


Cryptocurrency is one of the most popular innovations of the 21st century. It’s a digital money system that stands out from traditional money with two primary characteristics – decentralization and anonymity. Cryptocurrencies aren’t issued by central banks, so the government cannot have control over the supply. Instead, cryptos run on blockchain technology, a decentralized system that manages all the transactions.
For these reasons, people firstly didn’t rely on cryptocurrencies as much because they thought cryptocurrencies were of no value. But things have changed drastically since then, and cryptocurrencies have become one of the most exciting financial markets, with many preferring to buy Bitcoin over other assets such as Gold. In recent years with the rise of decentralized finance (DeFi) and non-fungible tokens (NFTs) many investors are also buying Ethereum.
There are several factors that you should carefully analyze before you make a crypto investment. This guide will explain how to read price charts, how cryptocurrency prices are changed, what determines their value, and how to invest in cryptocurrencies reasonably.
Cryptocurrency Prices Now – Top List by Marketcap
[fw_price_listing id=”530″]Another thing that makes buying cryptocurrencies so attractive is their volatility – they fluctuate sharply on several timeframes, especially the 1 minute and 5 minute chart, but even also on the 4 hour and daily charts.
This makes them a high-risk but also high-reward investment and a great market for active day traders. It also means that you must keep an eye on crypto prices, monitor market trends, and consider setting a stop loss and using several limit orders to scale into a position gradually (dollar cost averaging, or DCA) and get a better entry.
The table above displays the top ranked cryptocurrencies by marketcap, their 24 hour volume, and the change in each cryptocurrency prices over the last day. Similar tables are displayed on cryptocurrency price tracking websites such as Coinmarketcap and CoinGecko.
Stablecoins like Tether (USDT) also have a large marketcap and are used to buy and sell crypto temporarily when the market is volatile, without having to withdraw into fiat currency.
You can view cryptocurrency prices, news and network with other investors at social trading platform eToro. It’s both a regulated exchange where you can buy and trade crypto, and also a social media platform where you can share your thoughts on the markets and your predictions for coin prices.
 Bitcoin
1
Payment methods
Features
Usability
Support
Rates
Security
Selection of Coins
Classification
Rating
- Easiest to deposit
- Most regulated
- Copytrade winning investors


Don’t invest in crypto assets unless you’re prepared to lose all the money you invest.
How to Read Cryptocurrency Price Graphs
If you plan to trade cryptocurrencies, one of the essential steps is to learn how to read cryptocurrency charts and graphs. Technical analysis (TA) tools helps you better predict the price movements of an asset and find trends in the market. Generally, TA is a trading discipline that combines all the historical price data about the past trading activity of the asset and its price fluctuations that can help traders better understand its future price movements, based on the assumptions that markets always move in repetitive patterns.
This is in contrast to fundamental analysis (FA) that refers to a cryptocurrency’s roadmap and potential news developments in its technology or underlying use case, that may cause the price to pump regardless of whether the current price action (PA) looks weak and bearish. Or to dump even if the price action is clearly bullish.
Technical Analysis
Charles Dow, the editor of Wall Street Journal and co-founder of Dow Jones & Co, was the first to introduce technical analysis based on six essential principles.
Dow’s ideas were later combined to form what is today known as Dow theory. The latter has been improved over the years and adjusted to the current market trends. The following are the six tenets of Dow’s theory:
- The market discounts everything. This theory is closely related to the efficient market hypothesis, which states that the prices reflect all news and information about the asset. As soon as the information becomes available, it is immediately incorporated into the asset price, and the prices change appropriately.
- The market has three primary trends. These are the “main movement,” which can last from less than a year to several years; “medium swing,” which may last from ten days to three months; and “short swing,” which varies and can last from hours to months.
- Market trends have three phases. The first phase is the accumulation phase when the investors (the minority) actively buy the asset despite the existing opinion. The second phase is called public participation, in which the asset catches mass attention, and as a result of actively buying, its prices rise. And the last phase is distribution when more intuitive investors sell their holdings as they guess the trend will end soon.
- Indices must confirm each other. Charles Dow mainly associated this with the transportation market. To understand the fourth principle more clearly, we need to refer to Dow’s times, when many factories across the US used rail to transport their goods. Suppose company A uses transportation services from company Z to transport its manufactured items. According to the theory, the profits of company Z would rise if the profits of company A rise. The problem is that if A has more profits, it will manufacture more items; hence it will need more transportation services provided by Z.
- Volume confirms the trend. The trading volume of an asset indicates how much it was traded during a particular period. According to Dow, it’s a secondary indicator but plays an essential role in recognizing price signals. Dow theory suggests that during the uptrend, the volume will increase, and so will the price. In contrast, during the downtrend, the volume will decrease, and the price will do so.
- Trends continue until a definitive signal confirms that they ended. Finally, the last principle of Dow theory suggests that the trend continues despite the “market noise.”
Your capital is at risk.
As you can see, technical analysis tools and graphs can be of various types. Below we will shortly describe some of the most widely used tools among investors to make future price predictions.
Remember not to rely on just one strategy because a single method cannot precisely predict the market movements and PA. Instead, combine several tools and charts to have more productive results.
Line Charts
A line chart is one of the most basic and most uncomplicated technical tools used among investors. It’s a 2D graph that depicts the historical price of a particular cryptocurrency or another asset. In this graph, the continuous line connects the closing prices of an asset for each day. Due to its simplicity, the line chart is widely used among investors, as it clearly visualizes how the price fluctuates during a particular period.
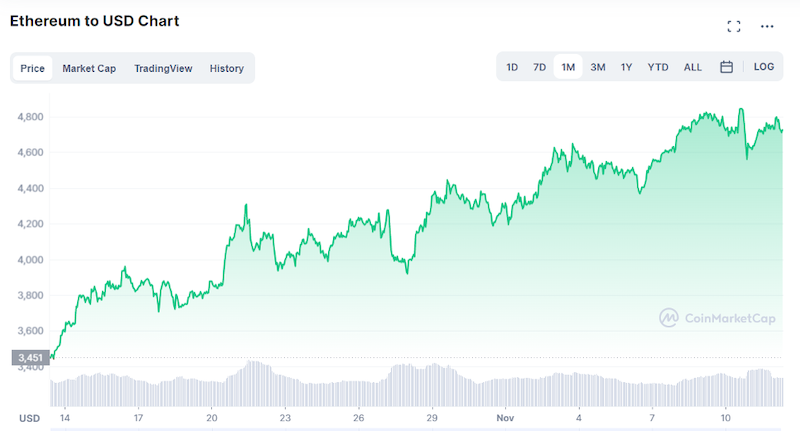
Line chart of ETH price action vs USD, via Coinmarketcap
When reading cryptocurrency price charts, it’s important to consider what Time frame you select for reviewing the price movements. You can choose whatever time frame you want but the most frequently used time frames among investors are 15-minute, hourly, daily, and weekly charts.
Traders typically select the time frame depending on what kind of trader they are. A short-term trader will use short timeframes such as 15-minute charts, while long-term investors use daily or hourly charts.
Your capital is at risk.
Candlestick Charts
Though line charts are easy and simple to use, they don’t represent thorough information about the cryptocurrency price movements. Hence, you need more detailed graphs, and there are plenty of them. Still, the Japanese candlestick chart is among the most favorite ones, as it offers more information due to its design.
It’s a graphical representation made by candlestick-like boxes of two different colors – green and red.
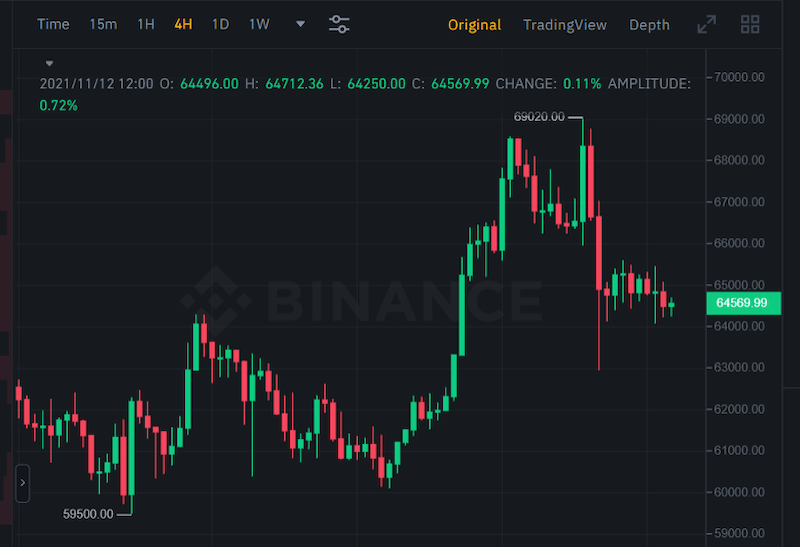
Japanese candlestick chart of BTC price action on 4h chart, via Binance
First of all, let’s understand the structure of these candlesticks. When we look at them, we can see that they are composed of a box called the candlestick’s body and lines, which is the shadow of the candlesticks.
The body represents the opening and closing prices of the cryptocurrency, while the shadow depicts the lowest and the highest costs of the crypto during a particular time.
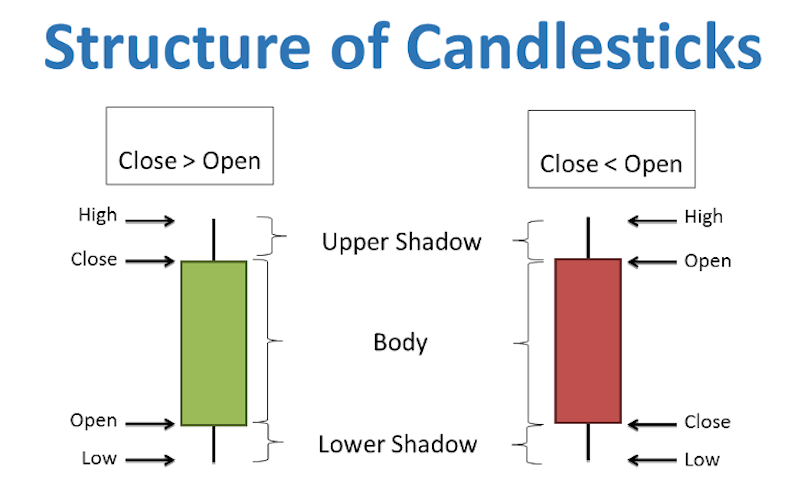
The structure of Japanese candlesticks
Now, when we know how to read Japanese candlestick charts, let’s discuss their colors. If you look at the graph below, you will see the sequence of two different colors.
The red color represents the bearish pattern which means that the prices have gone down during a particular time frame. In contrast, the green one symbolizes the bullish pattern indicating that the prices went high.
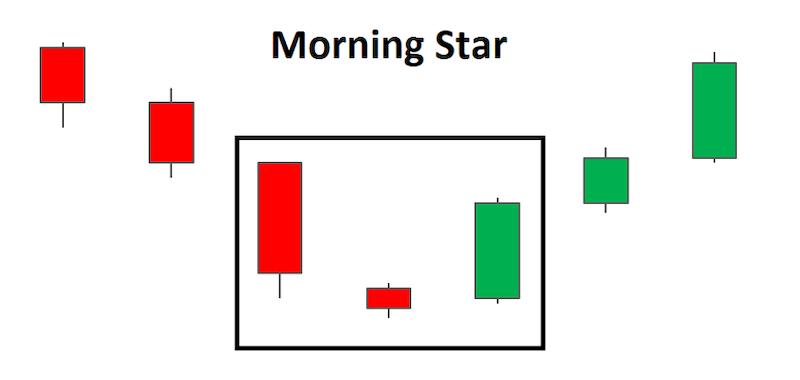
Japanese candlestick pattern, known as “Morning Star”
Japanese candlestick charts are so popular because they visually represent lots of necessary information for the investors. Still, these charts are not enough to make a thorough understanding of the market trends or the future price of a cryptocurrency.
Some traders prefer to use Heikin Ashi candles as they give a clearer indication of which way a cryptocurrency price chart is trending – candles stay green while the trend is bullish, and red while its bearish.
The major cryptocurrency exchanges such as eToro, Binance and Coinbase (it’s attached platform Coinbase Pro) give the option to use Heikin Ashi candles.
Your capital is at risk.
Technical Analysis Tools – Indicators
Below are some widely used technical analysis (TA) indicators that can provide more information and help traders predict cryptocurrency price movements.
RSI
Relative Strength Index or RSI is a technical indicator that helps understand whether the asset is oversold or overbought. It’s calculated through the formula RSI = 100 – (100/(1-RS)), and the number you get ranges from 0 to 100. Fortunately, you don’t have to do all the calculations yourself, as long as the exchanges/trading platforms already provide you with the data.
The important thing you need to know is that if RSI is below 30, the asset is oversold; hence the prices may go up soon; if it’s above 70, it’s overbought, so the prices are likely to decrease.
S/R Levels
Support and resistance levels are predetermined prices of a cryptocurrency at which they start to increase or decrease in value. These levels are introduced through trendlines on charts and help traders determine whether it’s a buy or sell period. The support price shows the lowest possible price of a cryptocurrency at which it is likely to go up. At this point, traders usually buy the cryptocurrency.
In contrast, the resistance level indicates that the prices are high enough to stop rising and will go down soon. At this point, traders sell their cryptocurrency.
But this is not applicable for all the periods. Sometimes, the cryptocurrency can break the support or resistance levels and set a new support or resistance level. Similar situations occur due to some factors, which we will discuss later.
MAs
Moving Averages are one of the most commonly used technical indicators in cryptocurrency trading. The idea of this tool is to create an average price of a cryptocurrency for a particular period. Moving averages can be of different types – simple (SMA), exponential or weighted (EMA), etc.
Simple moving averages or SMA is the most popular one, and it’s calculated as an arithmetic mean. Hence, it adds together the given prices of a cryptocurrency for particular days and divides it by the number of those days. SMA can be calculated for 20, 50, 100, and even for 200 days, which the investors use as buy and sell signals. EMA emphasizes the recent prices of a cryptocurrency, so it’s a weighted average calculation and is more responsive to new information.
MACD
Moving average convergence divergence (MACD) is another critical tool used by investors and is closely related to EMA. It’s calculated by subtracting the 12 days EMA from the 26 days EMA, forming a MACD line. Apart from it, there is a signal line that indicates the 9-day EMA.
If the MACD crosses above the signal line, traders usually buy the asset and sell it if the MACD crosses below the signal line.
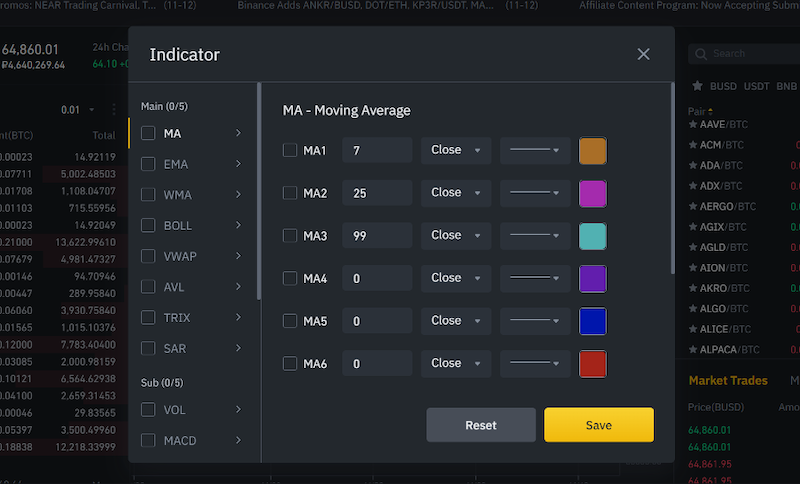
MAs provided by Binance and other technical indicators
OBV
An on-balance volume indicator is a technical tool developed by financial writer Joseph Granville and introduced in his book in 1963. This tool uses an asset’s trading volume to predict its price movements, as Granville believed that the trading volume plays a vital role in price movements.
On-balance volume (OBV) is calculated in various methods depending on the closing prices of that day and the previous day.
What is the Price of Cryptocurrency?
Looking at the cryptocurrency price comparison tables in this guide, you can notice two primary indicators: price and market capitalization. The price of the cryptocurrency is written next to its name. So, the following table, designed by Coinmarketcap, indicates that the Bitcoin price at the time of writing is $64,000. It shows the value of one bitcoin against USD. The table also indicates a circulating supply section which shows how many bitcoins are already mined and circulated.
By calculating the value of each coin with the number of already circulating coins, we can get the market capitalization of that cryptocurrency. Luckily, the market capitalization of each cryptocurrency is already calculated and introduced on the table under the section market cap. It’s considered a more critical tool to evaluate the worth of the cryptocurrency than the value of individual coins.
According to the market rules, the lower the supply, the more value a particular cryptocurrency has. In the case of bitcoin, it has a circulating supply of over 18 million coins, which is very scarce compared to several other digital currencies. Still, with this scarcity, each bitcoin is evaluated so high that it has the largest market cap ever.
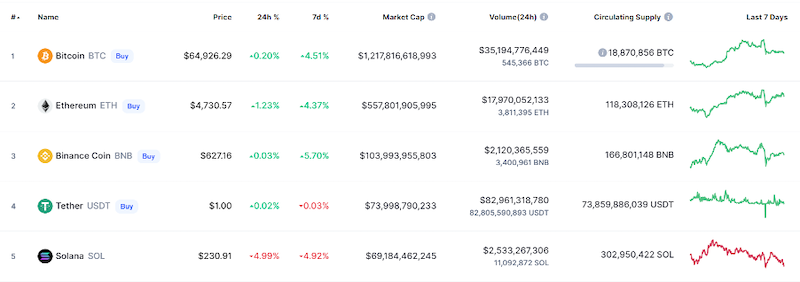
Five leading cryptocurrencies by their market cap. Source – Coinmarketcap.com
The market cap of a cryptocurrency is an essential tool to examine. The higher the market cap, the lower the risks, and vice versa. Market caps are classified into four different categories – mega-cap (more than $200b), large-cap ($10b-$200b), mid-cap ($2b-$10b), small-cap ($300m-$2b), micro-cap ($50m-$300m) and nano-cap (less than $500m). According to this classification, only Bitcoin and Ethereum are mega-cap cryptocurrencies.
What Determines the Price of Cryptocurrencies?
As a beginner in this field, you also need to know what drives the price of a cryptocurrency. It’s worth mentioning that cryptocurrency is not controlled by governments, financial institutions, and companies. It has a decentralized nature and uses blockchain technology to record and manage all the transactions. For this reason, such factors as inflation rates, monetary policy, and other factors that affect the prices of traditional currencies don’t really influence cryptocurrency prices.
The primary driving force of the crypto price is its supply and the demand for it. The demand and supply law suggests that if the product is scarce and its demand is high, its value increases. In contrast, if there is little demand for the product but it has an ample supply, it is less valuable. In this regard, those cryptocurrencies with a fixed maximum supply will be more valuable than those with an unlimited supply.
The maximum supply of a cryptocurrency is the number of coins that can ever be mined. Bitcoin, for instance, has a very scarce supply – only 21 million bitcoin can be mined, more than 18 million of which is already in circulation. This factor makes it a more valuable asset. In contrast, Ethereum has an unlimited supply of tokens, but there is a maximum limit of ETH that can be issued in a year, and it’s equal to 18 million.
Apart from the demand and supply law, several other factors can determine cryptocurrency price and even make it an overbought or an oversold asset.
 Among the factors that can severely affect cryptocurrency price are trends, endorsements by celebrities, and marketing. If a cryptocurrency gets more media attention and attracts more investors, there will be more people buying it; hence its value will grow.
Endorsement by public figures also plays a vital role, as they have huge audiences who are likely to mirror their favorite singer or actor. One such example was the Dogecoin price growth when Tesla and SpaceX founder Elon Musk started to devote many tweets to this memecoin and even to plan a space mission paid for in Doge.
Elon Musk and the billionaire Winklevoss twins also tweeted about the Shiba Inu price, which rose hundreds of thousands of percent in one of the most famous cryptocurrency pumps of all time.
Read the statements of fifteen different billionaire Bitcoin investors on crypto and their cryptocurrency price predictions.
Usability
For a cryptocurrency to rise in price and marketcap, it’s also crucial to have a practical use and solve a real-world problem. Bitcoin, for instance, is digital money that you can use to pay for goods and services, and several companies already accept payments through bitcoin.
Ethereum is used to pay the gas fees to make transactions on the Ethereum blockchain. These cryptocurrencies are likely to have more value and be more profitable in the long term, unlike the assets created just for speculation.
Apart from these two groups, there are also stablecoins that keep their value stable to eliminate the volatility and make crypto practical for daily purposes.
Another crucial factor that directly drives the cryptocurrency price is its mining system. Once again, let’s take the example of Bitcoin. To mine a new block and get rewarded, bitcoin miners have to solve complicated computational puzzles. It requires sophisticated equipment to power the computers and runs them all day long to finally mine a new block. Besides this, you will also need to pay high electricity bills. What’s more, the amount of BTC that can be mined is halved yearly, so the harder it becomes to mine it, the more money you spend on the mining process.
And last but not least, the competition in the field also significantly influences the prices. If there are several cryptocurrencies designed for the same purpose, the one that will provide better services and get more media attention will win in the long run. Hence, its value will increase too.
What Leads to Price Drops for Cryptocurrencies?
Why do cryptocurrencies experience price drops? To answer this question, we can again refer to the supply and demand law. According to it, if people start to sell their cryptocurrency, its supply increases while demand decreases. Hence, the prices drop when people begin to sell them in massive amounts. So, we need to understand why people sell them, and there are various reasons for this.
One possible reason is that a cryptocurrency reaches its resistance level – it is the point jumping to which an asset starts to drop in value. At this point, sellers take the game and begin to sell their assets to collect profits, due to which the supply increases and the prices drop.
The case for speculative assets is a bit different. They don’t have any practical use, so people buy them just for fun and trading. These kinds of cryptocurrencies usually gain attention through marketing and social media endorsement. People buy them because they are trending, and when they see that there is no room for this crypto to grow, they start selling it in significant amounts. As a result, bubble bursts, and the cryptocurrency price drops.
Apart from these factors, another thing that can hugely trigger a massive sell process is reputation. The case of Bitcoin’s drastic drop that took place in May 2021 can convince us of this. When Bitcoin price had aggressively increased and hit an all-time high, suddenly, a dramatic pullback occurred. It was mainly associated with two announcements – one made by Elon Musk, another by the Chinese government.
While Elon Musk announced that Tesla suspends transactions with Bitcoin, as its mining process severely damages the environment, the Chinese government introduced new restrictions connected with cryptocurrencies. Both of these announcements harmed bitcoin’s reputation resulting in major sell and price drops.
Predicting the Price of Cryptocurrencies
 Obviously, you invest in cryptocurrencies based on the predictions about their future price. But how do you make these predictions? Reading technical analysis charts, paying attention to their resistance and support levels, considering market trends play a vital role in the process. As mentioned previously, you must use all these tools in combination to get better results.
Another version is to use predictions made by AI-based algorithms that forecast cryptocurrency prices by analyzing the market. You can also follow experts’ opinions and compare your predictions with theirs. Another good solution is to use educational platforms, like InsideBitcoins, where we always introduce the hottest trends, and our team of experts frequently monitors the market to provide you with the most suitable investment opportunities.
Some of the latest new crypto projects include AiDoge, Copium, Launchpad, Sponge and yPredict.
Additionally, volume plays a significant role in predicting the future price of a cryptocurrency. It’s the number of trades conducted in that crypto asset during a particular period. On the Coinmarketcap table that introduces cryptocurrency market caps, you can find the trading volume section, indicating the trading volume of cryptocurrencies during 24 hours. CoinGecko is another similar website for tracking cryptocurrency price.
Why the Price of Cryptocurrencies Fluctuates So Much?
Cryptocurrencies are highly volatile compared to other assets, such as stocks, fiat currencies, commodities, etc. Looking at the chart below, you will see how the Ethereum price fluctuated in just one hour in recent days. One of the main reasons for such volatility is their freshness: this technology is relatively new, so it’s not well-established yet. People don’t have too much trust in cryptocurrencies, and their decisions on buying or selling them are usually based on public opinion. In short, presently it’s a speculative market.
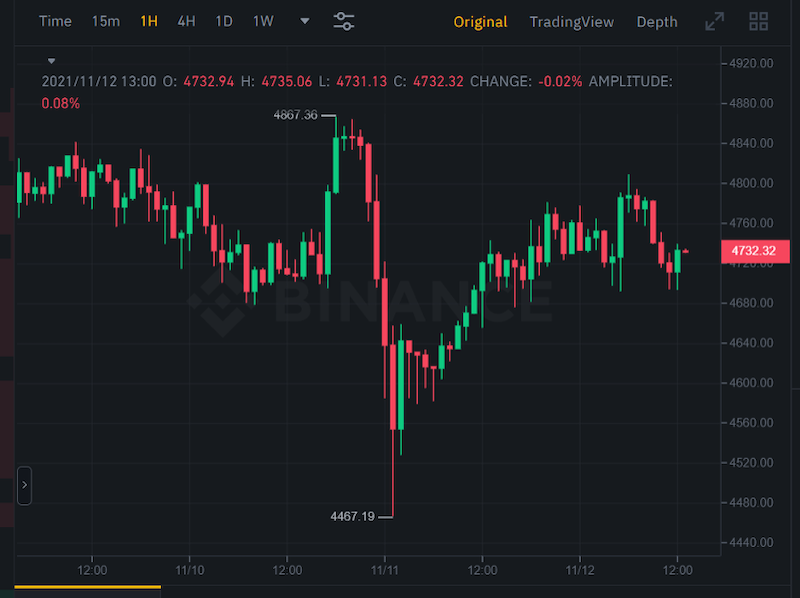
Ethereum price fluctuations in one hour. Source – Binance
Another reason is that a single party does not govern them; they are decentralized. It means that cryptocurrencies are not pegged to any fiat currency or physical commodity. So, their value is only determined by supply and demand law, especially for the cryptocurrencies with a fixed maximum supply. For this reason, even a single change in its demand and supply leads to price fluctuations. However, it does not refer to stablecoins, as they are created to stabilize crypto prices. They keep this stability by issuing more tokens when the demand increases and burning tokens if the demand decreases.
Another volatility is their usability. In previous years many altcoins have not had many significant uses yet other than being traded. Some of them are used for buying goods and services and other use cases, but many were simply bought and sold for profit and speculation.
Having said that, the price of 1 ETH was under $1 in 2015, and is now almost $5000 at the time of writing, so despite the price swings it has been one of the best performing financial assets in all of history, alongside Bitcoin.
Over time the crypto markets are becoming less volatile and more similar to the stock markets, as institutional investors are moving into crypto, providing more liquidity. Many cryptocurrencies can also now be staked to generate passive income, providing an incentive to continue holding them even if there is FUD and negative news in the markets. For example Ethereum (ETH), Cardano (ADA), and Tron (TRX) can be staked at eToro.
Your capital is at risk.
What Factors Could Potentially Influence the Price of a Cryptocurrency?
In the following list, we have summarized all the factors that can have a significant influence on the price of a cryptocurrency.
- The supply of a cryptocurrency and the market demand for it.
- Its mining process and rewards.
- Marketing and social media promotions.
- Endorsements by famous people.
- Practical use.
- Competition in the market.
- Uptrends and downtrends.
- Listing on major crypto exchanges.
- Future goals and the further development of a cryptocurrency project.
Predicting the Price of Cryptocurrencies with Machine Learning Technology
If you are short of time and cannot spend hours examining cryptocurrency graphs and charts to find the best investments, you can rely on Bitcoin robots that will do this for you automatically. A Bitcoin robot is a machine learning technology that analyzes the market instead of the trader and, based on the conclusions, buys Bitcoin and sells bitcoin for the trader.
As Bitcoin robots do all these calculations automatically, they work faster and more productively than humans do. Still, you cannot trust all the bitcoin robots, as long as there are many scammers that want to mislead the uninformed traders and steal their money. To find the most reliable bitcoin robots, you can review our guide on the top Bitcoin robots.
What to Bear in Mind When Investing in Cryptocurrencies
All in all, here is what you need to consider when you invest in cryptocurrencies.
In the first place, it’s advisable to examine how cryptocurrencies work and what makes them different from traditional money. Try to find the trending cryptocurrencies and review their goals and purposes. As soon as you select the interesting crypto projects that you think can bring you high rewards, you can start analyzing the market.
Next, you can jump to learning about the history of the selected cryptocurrencies. It involves paying attention to both fundamental and technical research analysis, trying to find factors influencing the price of those crypto assets, and using the combination of technical tools and charts to analyze its price movements. Multiple tools and indicators can significantly help you in this process, including the support and resistance levels, RSI, Moving averages, Japanese candlestick charts, and others, which we thoroughly discussed in the previous sections.
 To get fresh news and trends about trading in cryptocurrency, you can also follow social media, expert traders and examine the educational content on platforms such as eToro. Then you will be aware of what is going on in the market, what cryptocurrencies are trending, public opinion about this or that asset, crypto endorsements, and other factors that can help you predict the future prices of cryptocurrencies.
Now, when you think you are ready to invest in a cryptocurrency, you can develop a trading strategy and decide on the diversification of your portfolio. You can choose a single trading strategy or mix them, whatever you will find appropriate. When you start trading, again, you need to actively follow the news and price movements to know when you can sell it and buy new assets.
How to Invest Responsibly in Cryptocurrencies
Cryptocurrencies are attractive and promise high rewards, but you need to invest reasonably not to end up losing your capital. One of the most crucial things in the process is the carefully selected brokerage platform that guarantees your safety and charges competitive trading fees. When choosing an exchange platform, pay attention to its reputation, security, pricing structure, technical tools, etc.
Also, bear in mind not to invest all your money in just one asset, and always try to diversify your portfolio. Portfolio diversification, in most cases, will decrease the risks of losing your money. When you invest in multiple competing assets, you will still have the opportunity to get rewards from one asset if its competitor loses value.
Some investors see the native tokens of exchanges as a sure bet – a good investment as they have the backing and reputation of the exchange behind them. Two popular examples are Binance coin (BNB) and FTX token (FTT).
Taxation on Cryptocurrency Earnings
You still need to keep in mind one more thing – if you want to make money with cryptocurrencies, you will have to pay taxes. The United States IRS classifies bitcoin as property and applies taxes for bitcoin earnings as well. The taxes for Bitcoin fall in two large groups – long-term gains and short-term gains, depending on the period you hold them before getting rewards. Still, there are complexities when it comes to bitcoin taxes, so you can visit IRS websites to learn how your BTC will be taxed.
Conclusion
Predicting the future price of an asset is a tricky task, especially when it comes to cryptocurrencies. The Crypto market involves lots of risks and rewards, but to be overcome these challenges, you first need to do a thorough analysis of crypto trading for beginners. Exploring cryptocurrency price charts and market trends will help you better understand when to buy and sell them.
In addition, there are several factors you need to consider to be actively involved in trading. You need to have a deep understanding of demand and supply law, use multiple technical tools and charts, analyze the market trends, be aware of the factors influencing cryptocurrency price, etc.
We recommend regulated exchange eToro as it is a social trading platform where beginners and experts can network, discuss the markets, coin prices and future predictions – all users have their own social media style feed that they can post to. You can also copytrade a winning investor with a proven track record rather than try to time the short-term price swings and daytrade by yourself.
eToro - Our Recommended Crypto Platform![]()
![]()
FAQs
What is the price of cryptocurrency?
Cryptocurrency price indicates the value of each coin or token against USD. Another indicator of cryptocurrency wealth is its market cap, which is the circulating supply of its coins calculated by the value of each digital currency.
What determines the price of cryptocurrency?
The value of the cryptocurrency is determined through its supply and the market demand for it.
How to calculate the price of cryptocurrencies?
Cryptocurrency price and market cap are already calculated and introduced on crypto price tables, that meanwhile show the live changes in its price.
When does the price of cryptocurrency go down?
Cryptocurrency prices decrease if sellers take control of the market and sell vast amounts of it. As a result, its supply increases, and the demand decreases, which leads to the price drop.
What causes the price of cryptocurrency to rise?
Cryptocurrency prices increase when the buyers take control of the market and start buying in massive amounts. In this case, the supply decreases, and the demand increases resulting in price growth.
Which cryptocurrency marketplace allows you to buy and sell at a set price?
You can buy cryptocurrencies on crypto exchanges and brokerage platforms. The exchanges quickly adjust to the cryptocurrency price changes, so it’s hard to find a place where you can buy crypto at a set price.
What are the most volatile cryptocurrencies as of 2022?
Among the most volatile cryptocurrencies are Ethereum, Dogecoin, Filecoin, Algorand, etc. In fact, you can make quick profits from these cryptocurrencies as long as prices go up and down very often.
Where to get regular updates on the price of cryptocurrencies?
You can get lots of information about trends and updates on the price of cryptocurrencies on educational platforms, like Inside Bitcoins.