Join Our Telegram channel to stay up to date on breaking news coverage
Ethereum Price Prediction – November 11
The Ethereum price prepares for the uptrend and it may be fundamentally ready to break above $4800 respectively.
ETH/USD Market
Key Levels:
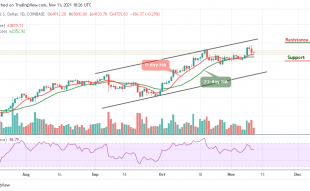
Resistance levels: $5100, $5200, $5300
Support levels: $4300, $4200, $4100
At the time of writing, ETH/USD is hovering above the 9-day and 21-day moving averages. Meanwhile, the second-largest cryptocurrency might kick-start another bullish run back above $4800 if the market price crosses above upper boundary of the channel. Therefore, the break above this barrier is the first signal needed for a bullish to press higher. Nevertheless, ETH/USD has to break beyond $4900 before hitting $5000 resistance level.
Ethereum Price Prediction: Ethereum (ETH) May Attract More Buyers
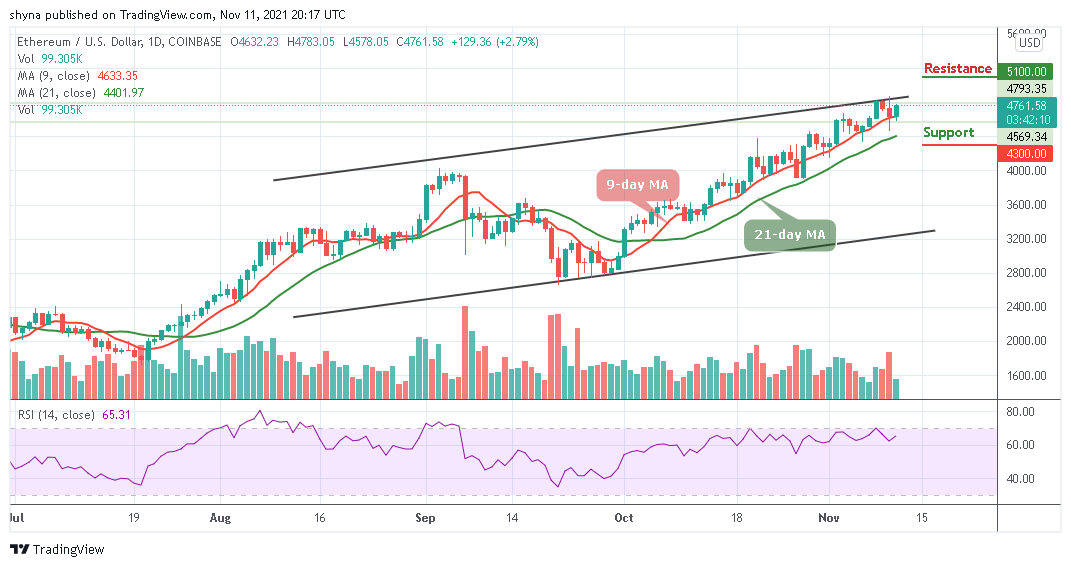
Looking at the daily chart, the Ethereum price aims to cross above the channel. If the buyers continue to grind higher, the first resistance level may be located at $4800 as this could also be followed by $4900. However, additional resistance levels may also be found at $5100, $5200, and $5300 respectively. On the other side, if the Ethereum price moves below the moving averages, it could hit the first support level at $4400.
However, sliding towards the lower boundary of the channel may lead the coin to the critical support levels at $4300, $4200, and $4100. Meanwhile, the technical indicator Relative Strength Index (14) makes a quick turn above 60-level, which indicates the buyers may continue to gain control of the market and this, could also mean that another signal of ETH could be pushing back towards $5000 soon.
When compares with Bitcoin, the daily chart shows that the Ethereum price is making an attempt to cross above the 9-day moving average around the 7291 SAT. However, as soon as the price crosses above the channel, there is a possibility that additional gains could be obtained. Therefore, the next resistance level above this level is close to the 7400 SAT level. If the price keeps rising, it could even break the 7600 SAT and above in the next positive move.
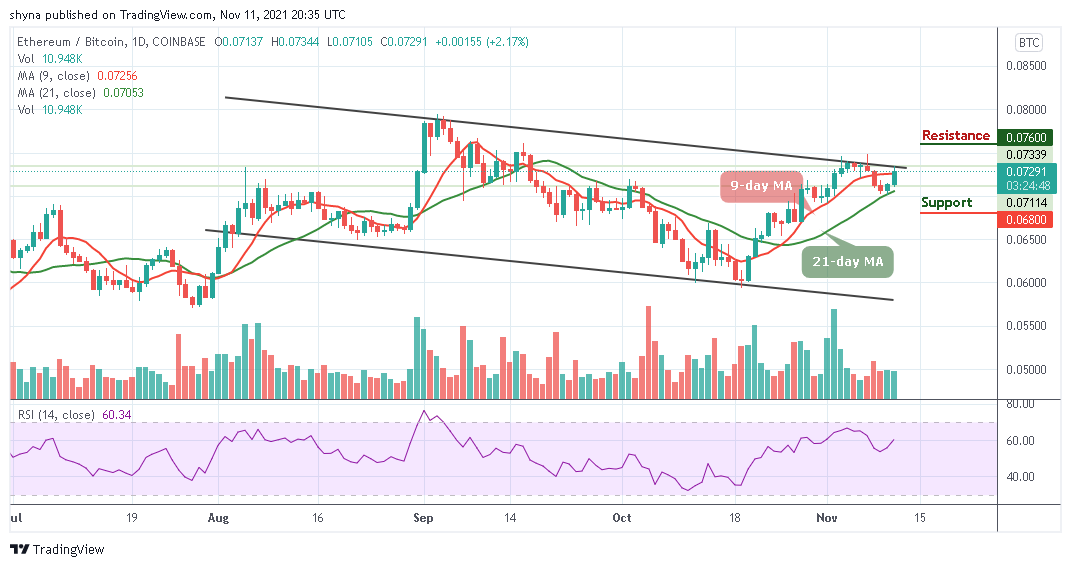
However, if the bears regroup and move below the 9-day and 21-day moving average, 7200 SAT and 7000 SAT supports may play out before rolling to the critical support at 6800 SAT and below. The Relative Strength Index (14) is likely to cross above 60-level, suggesting more bullish signals.
Looking to buy or trade Ethereum (ETH) now? Invest at eToro!
68% of retail investor accounts lose money when trading CFDs with this provider
Join Our Telegram channel to stay up to date on breaking news coverage