Join Our Telegram channel to stay up to date on breaking news coverage
Bitcoin Price Prediction – November 11
After touching the daily high of $65,600, the Bitcoin price drops over 0.46% as it trades around $64,725 level.
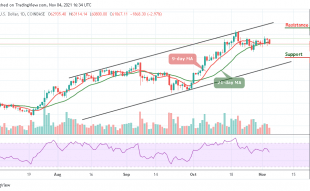
BTC/USD Long-term Trend: Ranging (Daily Chart)
Key levels:
Resistance Levels: $70,000, $72,000, $74,000
Support Levels: $60,000, $58,000, $56,000

BTC/USD is seen hovering below resistance level of $65,000, with the current movement, it is likely for the coin to cross below the 9-day and 21-day moving averages. However, the Bitcoin (BTC) begins the day off by trending lower toward the $64,000 level within the channel; crossing below the moving averages may locate the first support level at $62,000. Beneath this, support lies at $60,000, $58,000, and $56,000 levels.
Bitcoin Price Prediction: Bitcoin (BTC) Could Trigger Fresh Increase
The Bitcoin price has been gradually and persistently working on a recovery mission with the support of $64,000. Therefore, the largest cryptocurrency hovers at $64,725 as bulls failed to keep the coin above the 9-day and 21-day moving averages. On the downside, immediate support has been provided by the 9-day moving average at the $64,133 level. Holding above the short-term support is the key for sustaining the uptrend due to the stability exemplifies in the market.
On the upside, the Bitcoin price couldn’t go higher but seen dropping beneath the $65,000 level. Although the candle has not yet closes, however, it is likely that the bulls may end up closing above the resistance level of $65,000. More so, should in case the technical indicator Relative Strength Index (14) moves above 60-level, the resistance could be located at $70,000, $72,000, and $74,000 levels.
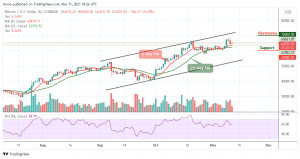
BTC/USD Medium-Term Trend: Ranging (4H Chart)
According to the 4-hour chart, traders can see that bears are likely to come back into the market if the bulls failed to defend the support at $64,000. However, the 9-day moving average is seen crossing below the 21-day moving average. Therefore, the $63,000 and below may come into play if the bearish movement continue to surface in the market.

On the contrary, if the buyers reclaim the market movement and push the coin above the moving averages, traders may expect a retest at the $66,000 resistance level; breaking this level may further allow the bulls to touch $67,000 and above. At the moment, the technical indicator Relative Strength Index (14) continues to move below 50-level, which may give additional bearish signals in the next negative move.
Looking to buy or trade Bitcoin (BTC) now? Invest at eToro!
68% of retail investor accounts lose money when trading CFDs with this provider
Read more:
- How to buy Bitcoin
- How to buy Cryptocurrency
Join Our Telegram channel to stay up to date on breaking news coverage