

The Altcoin Season Index (ASI) is a metric that measures whether the cryptocurrency market currently favors Bitcoin or altcoins. Operating on a scale from 0 to 100, this index tracks the percentage of top 50 altcoins outperforming Bitcoin over a 90-day period, with readings above 75 definitively signaling an “altcoin season.”
If you are a trader looking to maximize returns, the ASI provides crucial timing signals about market cycles, helping identify when capital rotation from Bitcoin to altcoins is occurring. When used alongside other indicators like Bitcoin dominance, the ASI offers investors a data-driven framework for strategic portfolio allocation across the volatile crypto space.
Key Takeaways
Understanding the Altcoin Season Index

The Altcoin Season Index ranges from 0 to 100. Higher scores indicate stronger altcoin performance when compared to Bitcoin. When the index reaches 75 or above, it signals an “altcoin season,” a period when most altcoins outperform Bitcoin. On the other hand, a score below 25 suggests Bitcoin dominance in the market.
The concept of the Altcoin Season Index emerged from the cyclical nature of cryptocurrency markets. Investors observed that these markets tend to move in cycles, with periods where Bitcoin dominates followed by periods where altcoins shine. This pattern created a need for a quantifiable way to identify these market phases, leading to the development of the Altcoin Season Index.
Altseason refers to a short time frame when capital shifts from Bitcoin (BTC) to altcoins, leading to a notable and rapid rise in the prices of most cryptocurrencies. Altcoin season, commonly known as ‘Altseason’, is characterized by massive gains and high volatility. During this relatively brief period, typically weeks or months, the values of altcoins soar as investors move their funds from Bitcoin to other coins.
The index plays a crucial role by:
- Helping investors identify optimal times to rotate between Bitcoin and altcoins
- Providing an objective measure of market sentiment
- Enabling traders to spot emerging trends before they become obvious
- Serving as a historical reference point for analyzing market cycles
How is the Altcoin Season Index Calculated?
To calculate the index, analysts track the top 50 altcoins (excluding stablecoins and wrapped tokens) and compare their performance against Bitcoin. This approach provides a broad view of market trends by focusing on established cryptocurrencies rather than newly launched tokens that might skew the results.
The calculation process involves several key steps:
Step 1: A time frame is selected
A 90-day period is typically used to provide a medium-term perspective that captures meaningful trends while filtering out short-term fluctuations.
Step 2: Altcoins are chosen for analysis
A specific number of altcoins from the top 50 is selected for calculation. In this selection, Bitcoin, stablecoins (like USDT and USDC), and wrapped tokens (like wBTC) are not included because they have no influence on the altcoin season.
Step 3: Individual performance is calculated
For every selected altcoin, the price change is calculated as a percentage.
Step 4: Comparison with Bitcoin
Bitcoin price change over the same duration is also calculated for comparison. An altcoin outperforms Bitcoin if its percentage is higher than that of Bitcoin.
Step 5: The index value is determined
The Altcoin Season Index is calculated by comparing the performance of each of the selected altcoins with Bitcoin. Altcoin season occurs when 75% or more of the chosen altcoins have a higher performance rate than Bitcoin.
The resulting index value, ranging from 0 to 100, represents the percentage of top altcoins that are outperforming Bitcoin. When most altcoins are doing better than Bitcoin, the index will be higher.
The Altcoin Season Index uses specific thresholds to categorize market conditions: Understanding what different ASI values indicate is crucial, so here’s a detailed breakdown of how to interpret the index: These ranges provide a framework for understanding market conditions, but it’s important to remember that the index is dynamic, changing in response to market movements. A rising index suggests increasing interest in altcoins, while a falling index indicates a shift back toward Bitcoin dominance. During an altcoin season, several key market indicators typically emerge: Looking at previous altcoin seasons provides some insights into market patterns and what triggers these periods: Previous alt seasons have increased various altcoin values, with some achieving exponential rises in relatively brief timeframes. We need to consider the trends of 2017-2018 and 2020-2021, as well as the present time. 2017–2018: ICO-Driven Boom 2020–2021: DeFi + Meme Coins Late 2023–Early 2024: Quiet Prelude Q2–Q3 2025: Signs of a New Alt-Season Analysts tied this shift to the April 2024 Bitcoin halving, around 380 days later, which is often the catalyst for the largest alt-seasons in history. However, given that only ~26 of the top 100 altcoins have outperformed BTC in the past 90 days, we are currently in a neutral/early phase of an alt-season. The Altcoin Season Index is a practical tool that can inform trading and investment strategies. Here’s how different market participants can leverage this indicator: Short-term traders can leverage the Altcoin Season Index to optimize their trading strategies through careful entry point identification, precise timing, methodical position management, and clear exit planning. When identifying potential entry points, look for the ASI rising from the 25 range alongside other bullish signals in the market. Watch for Bitcoin showing sideways consolidation patterns, altcoins breaking through key resistance levels, and increasing trading volumes that indicate growing investor interest. Rather than chasing any trending coin, focus on projects with strong technology, active development teams, and positive news momentum. Timing your trades effectively means considering entry when the index sits between 25-50 but demonstrates a clear upward trajectory. This approach helps capture more potential gains as the market shifts toward altcoin preference. Use technical indicators like moving averages to confirm uptrends, RSI readings to identify oversold opportunities, and support/resistance levels to establish strategic entry points with well-placed stop-loss orders. For position management, set clear profit targets based on technical indicators, volume patterns, and your risk tolerance. Implement trailing stop-loss orders that adjust upward as your target altcoins surge in value, securing profits while maintaining upside exposure. Consider a scaled exit approach by taking partial profits as the ASI climbs toward 75 rather than waiting for the full altcoin season to materialize. Develop clear exit strategies by watching for divergence between the ASI and price action – when the index begins declining while prices continue rising, it often signals weakening momentum. Pay attention to Bitcoin strength indicators; when BTC begins outperforming altcoins again, consider reducing your altcoin exposure. Watch for index reversals below 75 as a signal to secure profits and potentially exit positions as the market cycle shifts back toward Bitcoin dominance. So, to sum it up: Long-term investors can use the Altcoin Season Index as a strategic compass for portfolio decisions and market timing. The ASI provides valuable insights for balanced fund allocation across market cycles. When the index climbs into the 50-75 range, signaling an approaching altcoin season, investors should consider gradually increasing their exposure to quality altcoins with proven fundamentals. On the other hand, when readings drop below 25, consolidating positions in Bitcoin often proves prudent as the market enters a Bitcoin-dominant phase. Rather than attempting perfect market timing, savvy investors use the ASI to adjust their dollar-cost averaging strategy. During Bitcoin season, they direct more capital toward BTC while maintaining smaller altcoin positions. As the index rises toward neutral and altcoin territory, they gradually shift allocation toward promising altcoin projects, maintaining diversification while capitalizing on cyclical trends. The index serves as an excellent research trigger for forward-thinking investors. When the ASI begins climbing from low levels, this early signal prompts experienced investors to research quality altcoin projects before mainstream attention drives prices higher. This approach often leads to better entry positions and stronger long-term returns. By tracking the ASI across multiple market cycles, investors develop pattern recognition that informs their broader strategy. This historical perspective reveals how different cryptocurrencies respond to changing market conditions and helps anticipate future movements with greater accuracy. Regular monitoring enables timely portfolio adjustments as market dynamics shift. The ASI also strengthens risk management by providing clear market trend indicators. Understanding which phase the market occupies allows investors to adjust their approach accordingly, adopting conservative positioning during Bitcoin seasons and considering calculated, higher-risk exposure during emerging altcoin seasons. This approach helps preserve capital while capitalizing on the cryptocurrency market’s cyclical nature. Here are the main points: While the Altcoin Season Index is a powerful tool, it has several limitations that you should consider if you are an investor: The problem is that the index is reactionary. By the time it shows we’re in an altseason, it’ll be too late to enter at good prices. The ASI measures past performance and may not accurately predict future movements. Significant price movements may have already occurred. The index typically focuses on the top 50 or 100 altcoins by market capitalization, potentially missing emerging trends in smaller cryptocurrencies. This selection process can introduce bias and may not capture the full market dynamics. The crypto market is extremely volatile, and ASI might lack in offering the exact ratings. It should be used together with other tools for more accurate results. The unpredictability of the crypto is also a challenge. Different timeframes can yield different ASI values, making interpretation challenging during transitional market phases. Certain events, factors, and trends can also influence the prices of altcoins, and relying on a single tool can impose potential risk. The index doesn’t account for external factors like regulatory changes, technological advancements, or macroeconomic conditions that can impact cryptocurrency markets. Small-cap altcoins are particularly susceptible to manipulation, which can skew the index readings and lead to false signals. This is especially relevant during periods of high volatility. Due to the ASI changing frequently, the pricing is never static. While it primarily focuses on the previous 90 days from this perspective, this view is constantly changing due to new developments. No Guarantee: The ASI is an indicator that provides information for analysis, but is not meant to be an outlook. The ASI may be useful for checking for potential periods of altcoin outperformance, but it does not guarantee a price movement. You can track the Altcoin Season Index on several platforms that provide real-time insights. Blockchain Center’s Altcoin Season Index analyzes the performance of the top 50 cryptocurrencies (excluding stablecoins and asset-backed tokens) over the past 90 days. If 75% of these coins outperform Bitcoin during this period, it’s considered Altcoin Season. CoinMarketCap offers a similar index, evaluating the top 100 cryptocurrencies (excluding stablecoins and wrapped tokens) over a 90-day period. If 75% outperform Bitcoin, it’s Altcoin Season. CoinGlass provides an alternative perspective by analyzing the performance of non-Bitcoin cryptocurrencies to assess market trends. The Altcoin Season Index serves as a valuable compass for navigating the complex and volatile cryptocurrency market. Tracking the relative performance of altcoins against Bitcoin provides crucial insights into market cycles and helps investors identify potential opportunities for portfolio optimization. By using the Altcoin Season Index as part of a broader analysis toolkit, investors can make more informed decisions about when to allocate capital to Bitcoin versus altcoins. Remember that successful cryptocurrency investment requires continuous learning, adaptation, and a disciplined approach to risk management. No single indicator, including the ASI, should be used in isolation. Understanding market cycles and knowing when to adjust your strategy based on these cycles is key to long-term success in cryptocurrency investing. The Altcoin Season Index provides a data-driven framework for this analysis, helping you navigate the unpredictable and often volatile world of digital assets with greater confidence. Altcoin Season Index Thresholds
Interpreting the Altcoin Season Index
Index Range
Market Phase
What It Means
0-25
Bitcoin Season
Bitcoin is outperforming most altcoins. The market strongly prefers BTC, which is considered a safer store of value.
25-50
Bitcoin Season Is Closer
Bitcoin is still performing well against most altcoins, though not as dominant. Some select altcoins, particularly Ethereum, may show strength.
50-75
Altcoin Season Appears Closer
Transition phase with momentum shifting toward altcoins. An increasing number of altcoins are outperforming Bitcoin, and market attention is beginning to rotate.
75-100
Altcoin Season
Full altcoin season where most altcoins outperform Bitcoin. Characterized by massive gains, high volatility, and FOMO-driven market activity.
What Happens During an Altcoin Season?
Past Altcoin Seasons
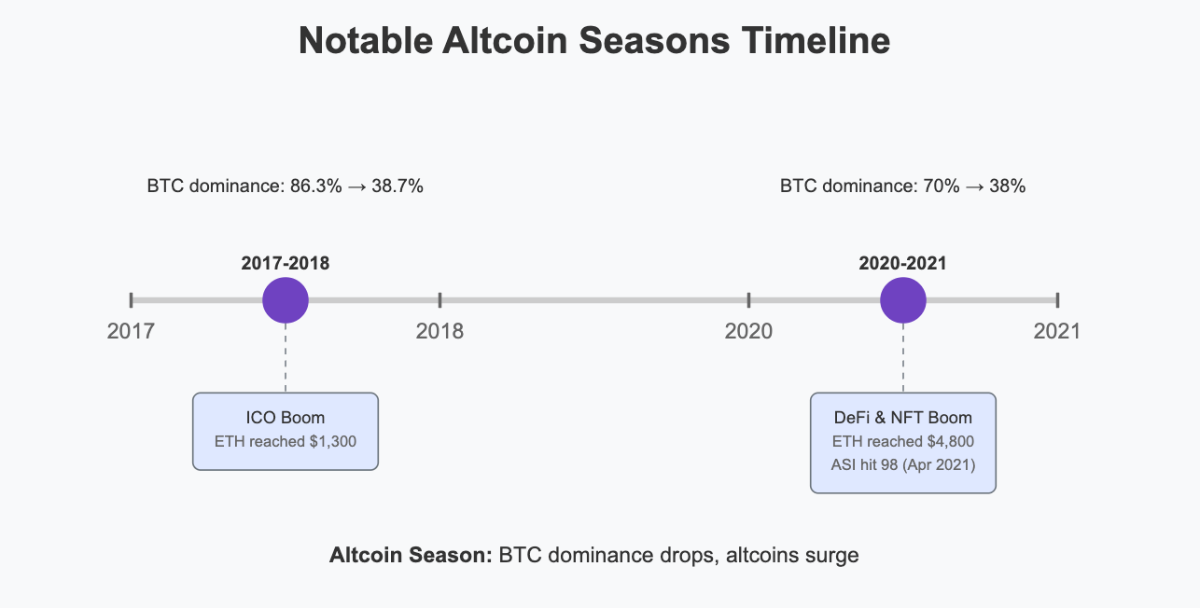
Bitcoin dominance plunged from 86 % to ~39 %, while BTC’s price tumbled from over $20K to below $6K. This shift fueled a massive interest in ICOs – Ethereum surged past $1,300, and XRP briefly edged out ETH in market cap. These token launches captured retail attention and set the stage for an explosive alt-season.
Triggered by the pandemic, this phase saw BTC dominance shrink from 70 % to ~38 %. Altcoins saw triple-digit gains and NFTs and DeFi played central roles, while meme coins like Dogecoin and Shiba Inu soared. The Altcoin Season Index peaked around 98 in April 2021, confirming the meteoric rise.
Market activity was subdued. Despite early whispers, only ~14 % of major altcoins outperformed BTC over 60 days, in stark contrast to the 75 % threshold for a classic alt-season. Bitcoin’s dominance hovered near 63%, keeping most altcoins on the sidelines.
Recent indicators suggest fresh capital is rotating into altcoins. Bitcoin dominance has eased to ~63 %, down from recent highs, which is often a prelude to altcoin strength. A “golden cross” in April 2025, when the altcoin market 50-day moving average crossed above the 200-day, mirrored 2021’s setup, sparking renewed optimism.How to Use the Altcoin Season Index
For Traders
For Investors
Limitations of the Altcoin Season Index
Retrospective Nature
Selection Bias
Variable Timeframes
External Factors
Market Manipulation
Dynamic Nature
No Guarantees
Where Can I Find the Altcoin Season Index?
BlockchainCenter’s Altcoin Season Index
CoinMarketCap’s Altcoin Season Index
CoinGlass Altcoin Season Index
Conclusion
Altcoin Season Index FAQs
What is the Altcoin Season Index?
How is the Altcoin Season Index calculated?
What does an ASI value of 75 indicate?
What is considered a Bitcoin season?
Can the Altcoin Season Index predict future market trends?
Which altcoins are included in the ASI calculation?
How often is the Altcoin Season Index updated?
Where can I find the current Altcoin Season Index?
Is the Altcoin Season Index relevant for long-term investors?
References