Join Our Telegram channel to stay up to date on breaking news coverage
USDCAD Price Analysis – June 20
The pullback is inevitable after a particular breakout. Further increase in the bearish momentum will decrease the USDCAD to the demand level of $1.3111.
USD/CAD Market
Key levels:
Supply levels: $1.3367, $1.3493, $1.3648
Demand levels: $1.3207, $1.3111, $1.2977
USDCAD Long-term trend: Bearish
USDCAD maintain its bearish movement on the long-term outlook. The pullback observed by the currency pair on June 14 led to the breakup of the $1.3493 level. The bearish reversal candle pattern called Evening Star emerged at the just mentioned level. The pair obeyed the Bears’ command and the currency dropped towards $1.3207 level.
Today, another big daily bearish candle formed that penetrates the $1.3207 level downside and the currency is currently exposed to the demand level of $1.3111. The pair continues its trading below the 21 periods EMA and 50 periods EMA in which the later has crossed down the former. The Stochastic Oscillator period 14 is at 25 levels with the signal lines bending down to indicate sell signal.
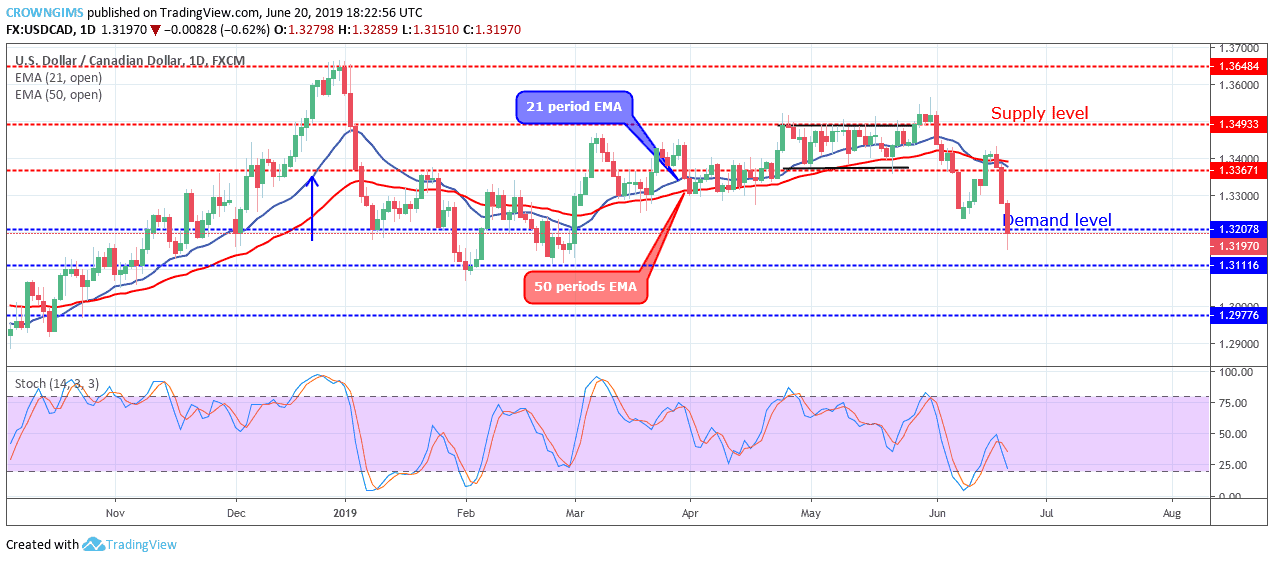
The pullback is inevitable after a particular breakout. Further increase in the bearish momentum will decrease the USDCAD to the demand level of $1.3111.
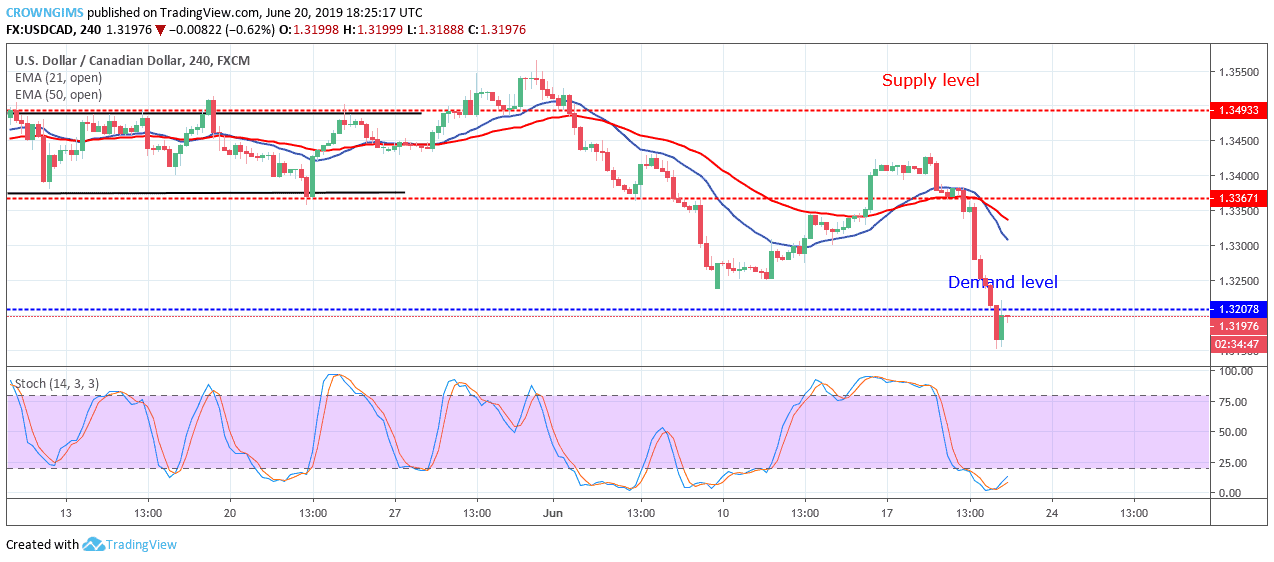
USDCAD medium-term Trend: Bearish
USDCAD is bearish in the medium-term outlook. On the 4-hour chart, the Bears hold tight to the USDCAD market. After the price retracement that took place last week, the USDCAD price descended towards the $1.3207 price level.
The 21 periods EMA has crossed the 50 periods EMA as a bearish movement confirmation. USDCAD price is trading below the 21 periods EMA and 50 periods EMA.

The Stochastic Oscillator period 14 is at the oversold region and the signal lines pointing up to indicate a buy signal.
Please note: insidebitcoins.com is not a financial advisor. Do your own research before investing your funds in any financial asset or presented product or event. We are not responsible for your investing results.
Useful links
Join Our Telegram channel to stay up to date on breaking news coverage