Join Our Telegram channel to stay up to date on breaking news coverage
Litecoin Price Prediction – December 22
The Litecoin price prediction remains below the moving averages following the current bearish action in the market.
LTC/USD Market
Key Levels:
Resistance levels: $190, $200, $210
Support levels: $130, $120, $110
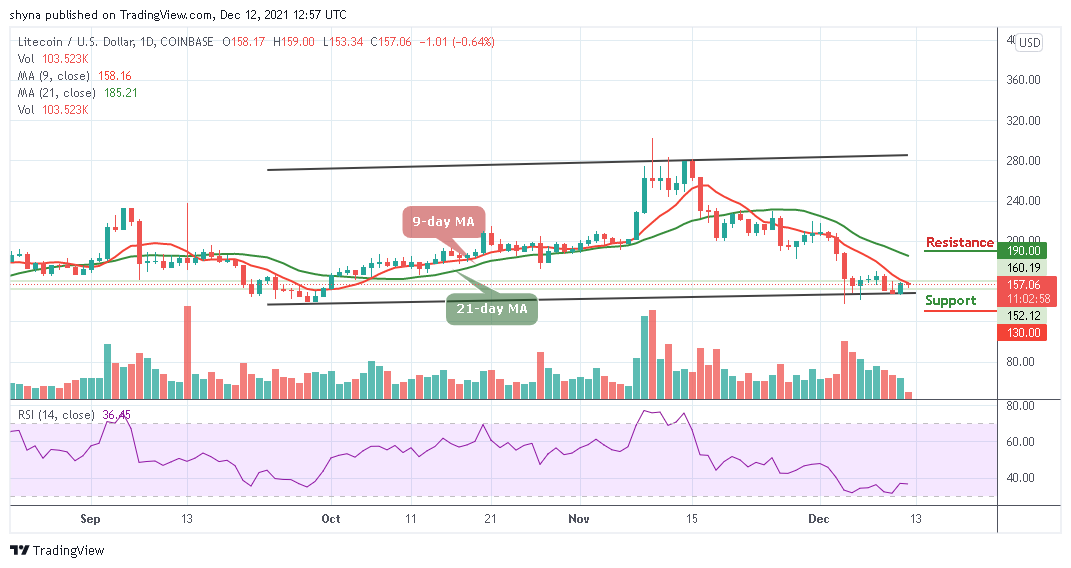
The daily chart reveals that LTC/USD has remains at the downside as the coin continues to follow the bearish trend while the cryptocurrency focus on the downtrend. At the time of writing this, the Litecoin price is currently trading below the 9-day and 21-day moving averages as the price may cross below the lower boundary of the channel.
Litecoin Price Prediction: Litecoin (LTC) May Continue to Range-bound
The coin is yet to recover from the current trading levels, therefore, it is likely that traders may see the Litecoin price fall to a new trading low. A break below the lower boundary of the channel may provoke a deeper decline towards the critical supports at $130, $120, and $110 levels. The short-term technical analysis shows that the coin is likely to follow a sideways movement.
Looking at the daily chart, a break above the 9-day moving average may take Litecoin towards the nearest resistance level of $180 while a further push could take it to a high of $190, $200, and $210 resistance levels. Presently, the technical indicator Relative Strength Index (14) is moving in the same direction, crossing into the oversold region could cause the market to experience another deep fall.
When compares with BTC, Litecoin (LTC) is still experiencing another downtrend within the channel, especially in the past few days. The coin remains below the 9-day and 21-day moving averages and may continue to fall through subsequent support level to 3000 SAT. The critical support level is located below the lower boundary of the channel at the 2800 SAT and below.
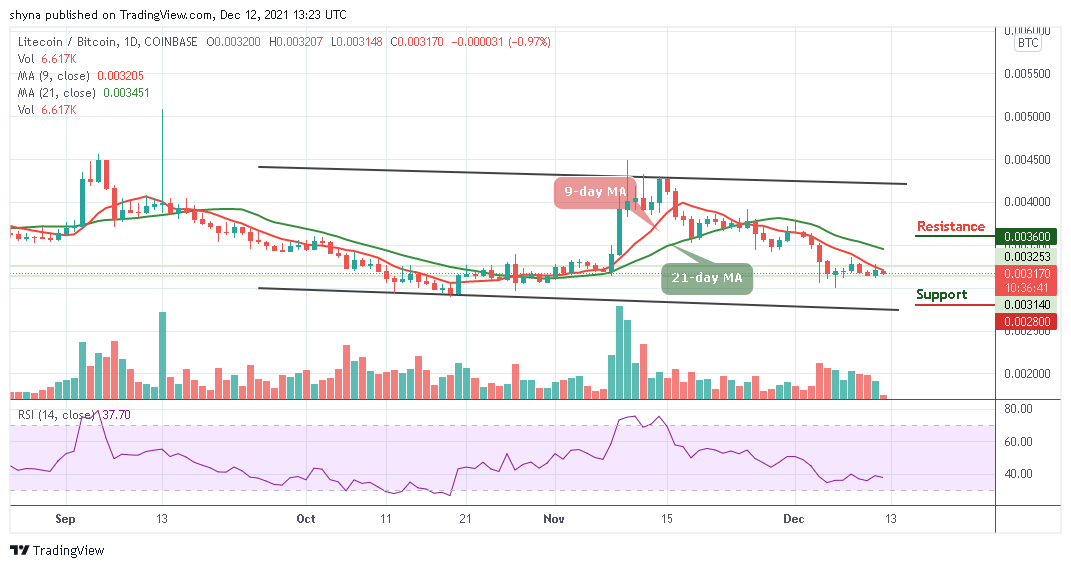
However, if the bulls manage to power the market, traders may likely find the resistance level at 3600 SAT and above. Meanwhile, the Litecoin price is currently changing hands at 3170 SAT but a surge in volatility may occur as the technical indicator Relative Strength Index (14) may move above the 40-level, meaning that a bullish trend may play out.
Looking to buy or trade Litecoin (LTC) now? Invest at eToro!
68% of retail investor accounts lose money when trading CFDs with this provider
Join Our Telegram channel to stay up to date on breaking news coverage