Join Our Telegram channel to stay up to date on breaking news coverage
Bitcoin Cash Price Prediction – October 30
The Bitcoin Cash price is likely to continue with the downward momentum as revealed by the technical indicator.
BCH/USD Market
Key Levels:
Resistance levels: $700, $750, $800
Support levels: $500, $450, $400
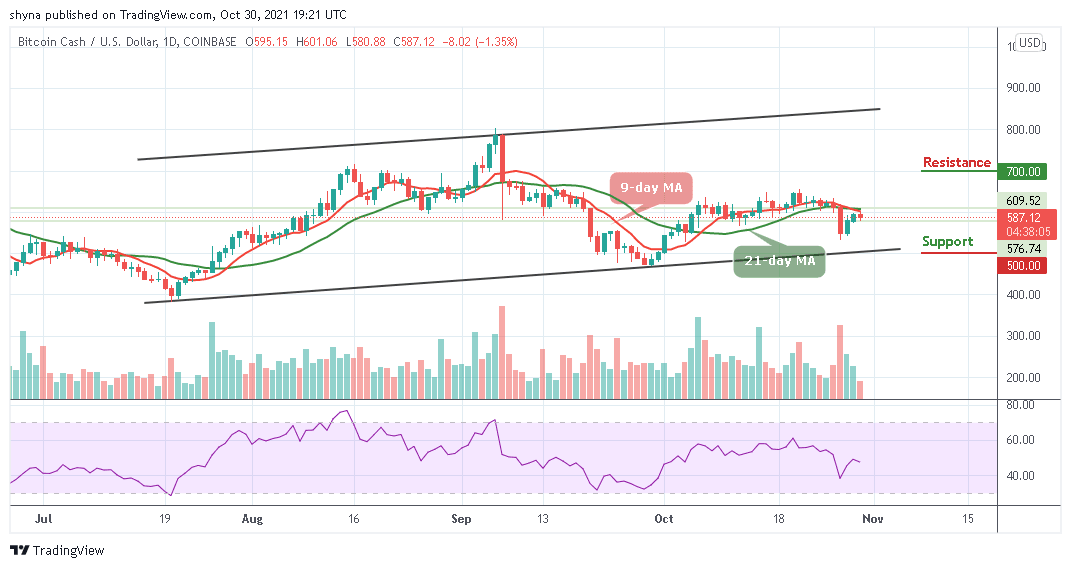
At the time of writing, BCH/USD peaks at $601 but now following a downward movement within the channel. Meanwhile, the price not staying above $600 ruins the long-term technical picture of the coin. Bitcoin cash will have to hold this ground to guide against the further downward pressure and the closest support expects the coin at $550. Once it is eliminated, the downside may likely grow, with the next goal supporting $500, $450, and $400 levels.
Bitcoin Cash Price Prediction: Bitcoin Cash (BCH) Is Likely to Fall More
The Bitcoin cash price is hovering at $587.1 but yet to break above the 9-day and 21-day moving averages. On the upside, a sustained move above $600 may ease the initial downside pressure and create momentum for the bulls with the focus to move the market to the next resistance levels of $700, $750, and $800 respectively. At the moment, the technical indicator Relative Strength Index (14) is likely below 50-level, which indicates that the downward momentum may likely play out.
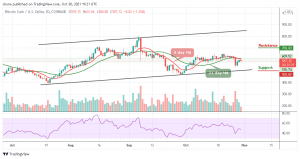
However, we realize that the previous uptrend within the channel was necessary for the bullish action. More so, the support formed between $533 provided air-tight protection allowing the buyers to concentrate on stirring action towards the north.
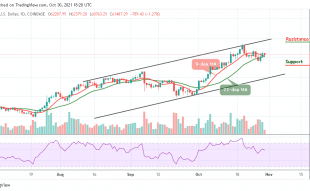
When compares with Bitcoin, the daily chart reveals that the bears have been dragging the coin to the south. However, following the recent negative signs, the trend may continue to go down if the sellers continue to pump more pressure into the market.

However, as the technical indicator Relative Strength Index (14) remains below 35-level, if the buyers can hold the support of 952 SAT, the market price may likely face the upward movement, while pushing further may take it to the resistance level of 1100 SAT and above but a cross below the lower boundary of the channel could lead the price to the support of 850 SAT and below.
Looking to buy or trade Bitcoin Cash (BCH) now? Invest at eToro!
68% of retail investor accounts lose money when trading CFDs with this provider
Read more:
Join Our Telegram channel to stay up to date on breaking news coverage