Join Our Telegram channel to stay up to date on breaking news coverage
BCH Price Analysis – April 26
BCH/USD trades above the moving averages as the price fluctuates in sideways.
BCH/USD Market
Key Levels:
Resistance levels: $280, $290, $300
Support levels: $195, $185, $175
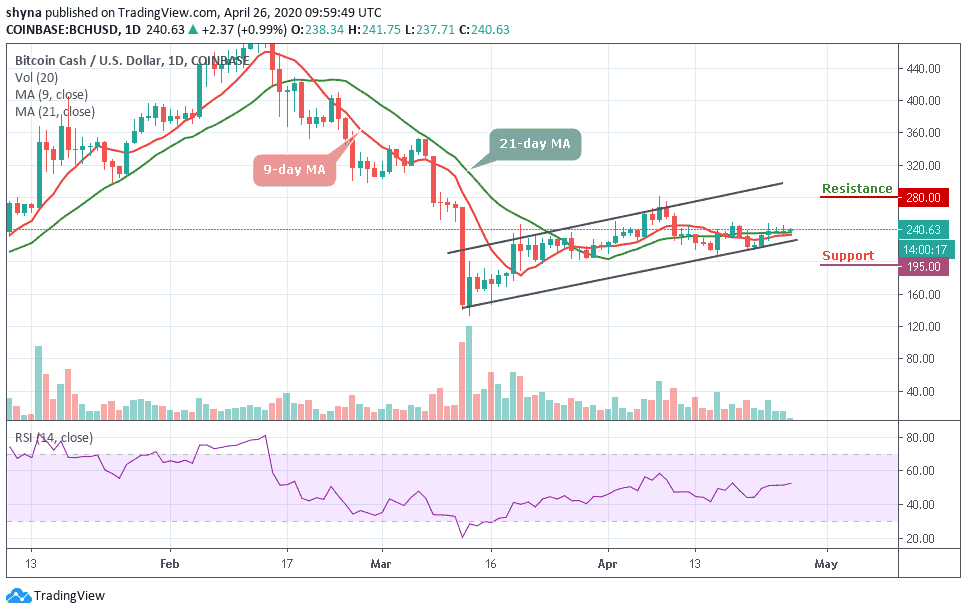
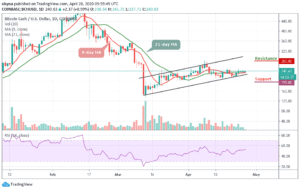
BCH/USD has been following a sideways movement since four days ago. The coin has not been able to maintain a consistent bullish run within the daily chart. However, it may continue to show some signs of an upward movement slowly till the latter part of the day. Meanwhile, for the past few days, the market has been forming a pattern where the day begins with having an uptrend, but most of the time towards the end, it reverses.
Moreover, the Bitcoin Cash price has continued to consolidate itself within the ascending channel crossing above the 9-day and 21-day moving averages. More so, the daily breakdown reveals that for the past few days, BCH/USD has increased in price where it moves from $217 to where it is currently trading at $240. Therefore, the bulls need to hold the current price tightly in order to go higher. If this is achievable, more price break out may occur as the buyers may find new weekly highs at $280, $290, and $300 resistance levels.
In other words, if the bulls fail to push the price higher; BCH/USD may likely fall below the channel at $210 and while trading at this level, a breach could slump the market to another supports of $195, $185 and $175 levels, creating a new low for the coin. At the moment, the RSI (14) indicator is moving in the same direction around 52-level. Meanwhile, a bullish cross might reveal a buy signal for the market.
Again Bitcoin, the market has evolved for a while in a very different way. But currently, the sellers are gaining the market as the price is trading under the 9-day and 21-day moving averages around the lower boundary of the channel while the RSI (14) moves around the 38.41-level.
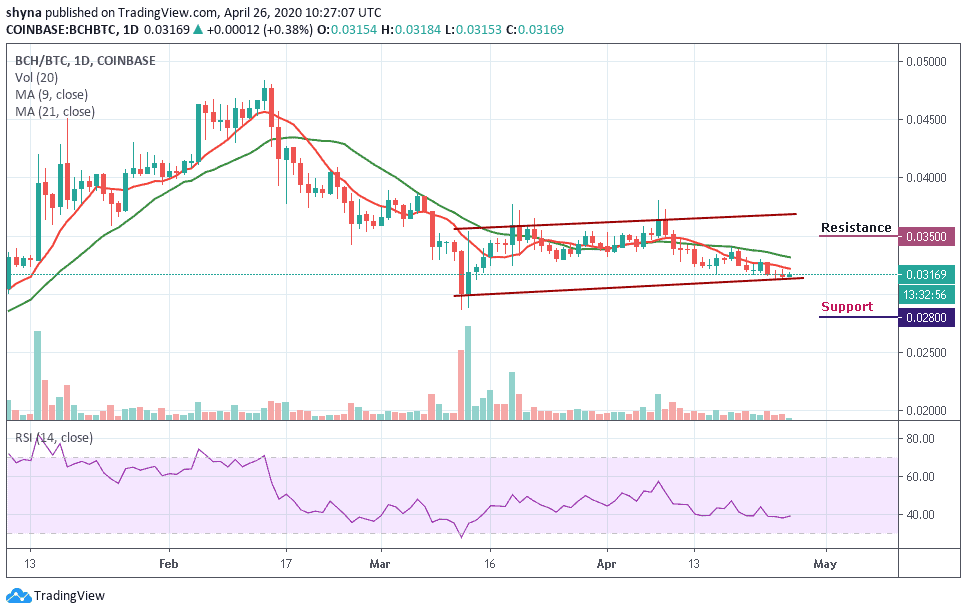
However, the downtrend is seen giving the sellers more confidence to increase their entries. More so, if the bears succeeded in the broken price, one would expect the market to fall to the support level of 0.028 BTC and 0.027 BTC. Meanwhile, a rebound could increase it to the resistance level of 0.035 BTC and 0.036 BTC.
Please note: Insidebitcoins.com is not a financial advisor. Do your research before investing your funds in any financial asset or presented product or event. We are not responsible for your investing results.
Join Our Telegram channel to stay up to date on breaking news coverage