Join Our Telegram channel to stay up to date on breaking news coverage
Bitcoin Cash Price Prediction – May 23
The Bitcoin Cash price prediction shows a sudden dip below $500 today as the coin looks set to enter deeply into the negative side.
BCH/USD Market
Key Levels:
Resistance levels: $900, $1000, $1100
Support levels: $190, $90, $-100
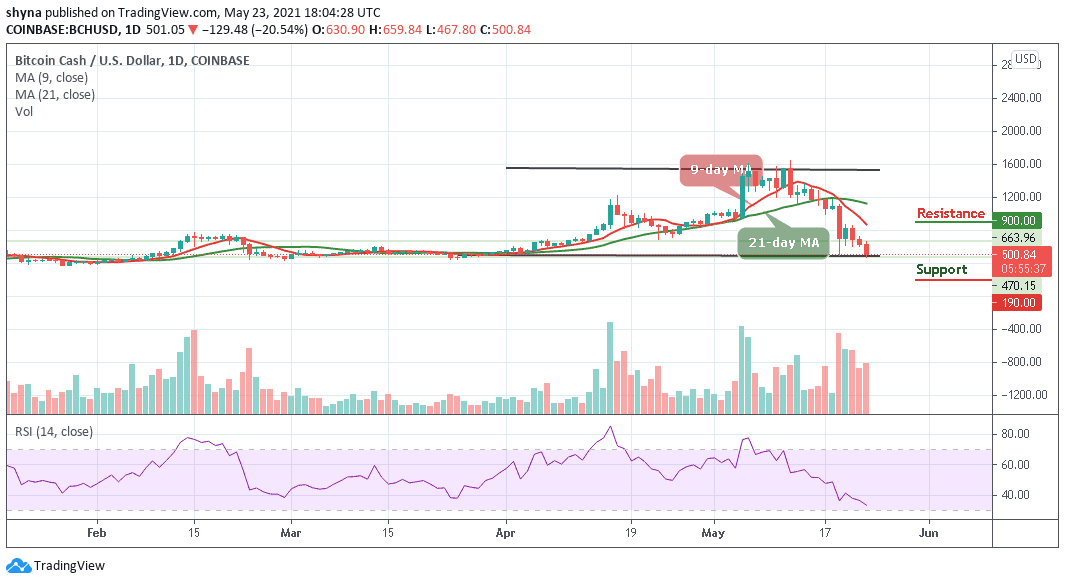
BCH/USD is currently in a downtrend as bears dominate the entire cryptocurrency landscape. At the time of writing, BCH/USD is hovering below the 9-day and 21-day moving averages as the trend has a bearish inclination, which may likely touch the support at $300.
Adding to that, technical indicators have remained bearish, with the Relative Strength Index (14) continuing to dig deeper into the oversold region.
Next Direction for Bitcoin Cash?
As the daily chart reveals, the best bulls can do is to defend the support at $300 and focus on pushing up towards $700. For a few days now the Bitcoin Cash price has been locked in a downward channel, as the sharp drops undermine buyers contemplating an attempted recovery above $650.
As buying pressure increases, the price may break above the 9-day moving average and reach the resistance at $850. If trading returns to that level, then a bullish continuation could reach the resistance levels at $900, $1000, and $1100, respectively.
In other words, if the coin remains on the negative side, a minimum swing could bring the price to a $300 level. Exceeding this level could take the bears to $190, $90, and even lower $sub 100 levels by crossing below the lower boundary of the channel.
Against Bitcoin, the daily chart reveals that bears continue to push the price in a southerly direction. The most recent negative sign suggests that the trend could continue to follow the downtrend as buyers were unable to push the price above 9-day and 21-day moving averages.

However, as the Relative Strength Index (14) slides below the 40-level, it may likely cross into the oversold region and a bearish continuation could lower the price to the support levels of 0.012 BTC and below. But once it moves out of this zone, the market price may likely begin an upward trend to push the Bitcoin Cash price towards the resistance level of 0.020 BTC and above.
Looking to buy or trade Bitcoin Cash (BCH) now? Invest at eToro!
75% of retail investor accounts lose money when trading CFDs with this provider
Join Our Telegram channel to stay up to date on breaking news coverage