Join Our Telegram channel to stay up to date on breaking news coverage
Bitcoin Price Prediction – May 21
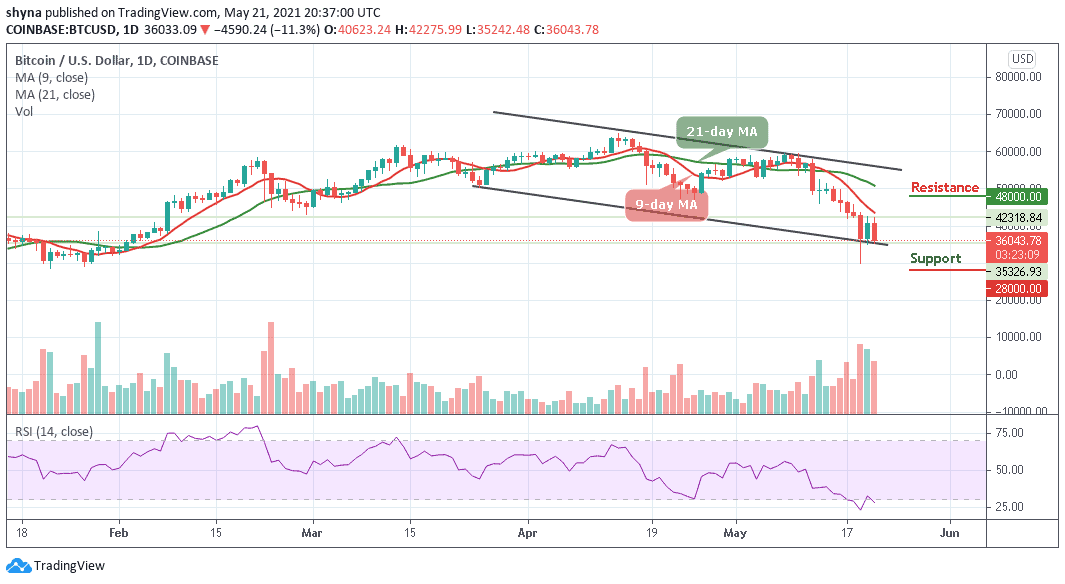
Today, BTC/USD faced a pullback as the price slide below $40,000 and tested support near the $35,000 level.
BTC/USD Long-term Trend: Bearish (Daily Chart)
Key levels:
Resistance Levels: $48,000, $50,000, $52,000
Support Levels: $28,000, $26,000, $24,000

BTC/USD has not been able to breach the $42,000 resistance level following a recent rejection at $42,275. On the downside, support has been established at $35,242. BTC/USD is trading at $36,043 at the time of writing. The prevailing trend is having a bearish bias but the bullish interest has not left the market in spite of the resistance at $42,000.
Bitcoin Price Prediction: What to Expect from Bitcoin (BTC)
At the moment, the Bitcoin price is deciding below the 9-day and 21-day moving averages, where the sellers are anticipating a clear breakdown below the channel. More so, if the red-line of 9-day MA remains below the green-line of 21-day MA, the market may continue to experience more downtrends. Nevertheless, should the $40,500 level holds, the $42,000 and $44,000 levels may further surface as potential resistances where a strong bullish spike might take the price to the resistance levels of $48,000, $50,000, and $52,000.
Moreover, if the market continues to follow the downward trend, the price of Bitcoin is likely to drop to $30,000, and should this support fails to contain sell-off, we could see a further roll back to $28,000, $26,000, and $24,000 support levels. Meanwhile, the technical indicator Relative Strength Index (14) is back within the oversold zone, therefore, the Bitcoin price may continue to fall more.
BTC/USD Medium – Term Trend: Bearish (4H Chart)
The 4-hour chart reveals that the Bitcoin price is following the bearish movement at the time of writing this, trading below the 9-day and 21-day moving averages of around $35,350. Meanwhile, the coin is yet to slip below the $30,000 support but it is still in the loop of making a bounce back as it may take time to persistently trade above $40,000.

Moreover, BTC/USD is making an attempt to cross below the lower boundary of the channel as the technical indicator Relative Strength Index (14) could move into the oversold region. Therefore, this could continue the bearish movement which may likely drag the Bitcoin price to the nearest supports of $31,000 and below while the potential resistance lies at $40,000 and above.
Join Our Telegram channel to stay up to date on breaking news coverage

