Join Our Telegram channel to stay up to date on breaking news coverage
Ethereum Price Prediction – May 19
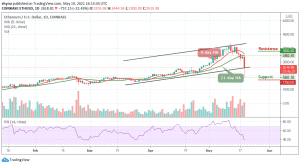
The Ethereum price sits at a crucial support level that would likely determine where the coin will be heading next.
ETH/USD Market
Key Levels:
Resistance levels: $3800, $4000, $4200
Support levels: $1700, $1500, $1300

ETH/USD follows in the footsteps of the flagship cryptocurrency as it dropped roughly 22.43% on the day. The Ethereum price failed to break above the 21-day moving average at $3444. Meanwhile, if there is short-term selling pressure, Ethereum will most likely tackle it and make a comeback at the level mentioned above.
Ethereum Price Prediction: Can it Go Lower?
As revealed by the daily chart, Ethereum saw a slight spike in profit-taking after creating a daily high of nearly $3500. However, the increasing selling pressure pushed ETH/USD to hit a new low of $1900. As long as the red-line of the 9-day moving average holds above the green-line of the 21-day moving average, the Ethereum (ETH) can rebound toward higher highs.
However, if the buyers manage to maintain the bullish momentum, a slight upswing could push the Ethereum price back above the 9-day and 21-day moving averages as the coin could hit the resistance levels of $3800, $4000, and $4200 respectively. Therefore, a failure to stay above this barrier could spell trouble for the Ethereum price.
Following this, the downswing could trigger a sell-off to the immediate support barrier that ranges from $2000 to $2500 levels below the lower boundary of the channel. As the Relative Strength Index (14) moves to cross below 40-level, it is likely for the Ethereum price to locate the supports at $1700, $1500, and $1300.
When compares with BTC, the last few hours have revealed a breakdown on the long channel after a continuous selling pressure in the market which led to the current trading price at around 6901 SAT. However, this reveals that bears are in control of the market. The Relative Strength Index is now revealed at 55-level, revealing the ongoing price drop.
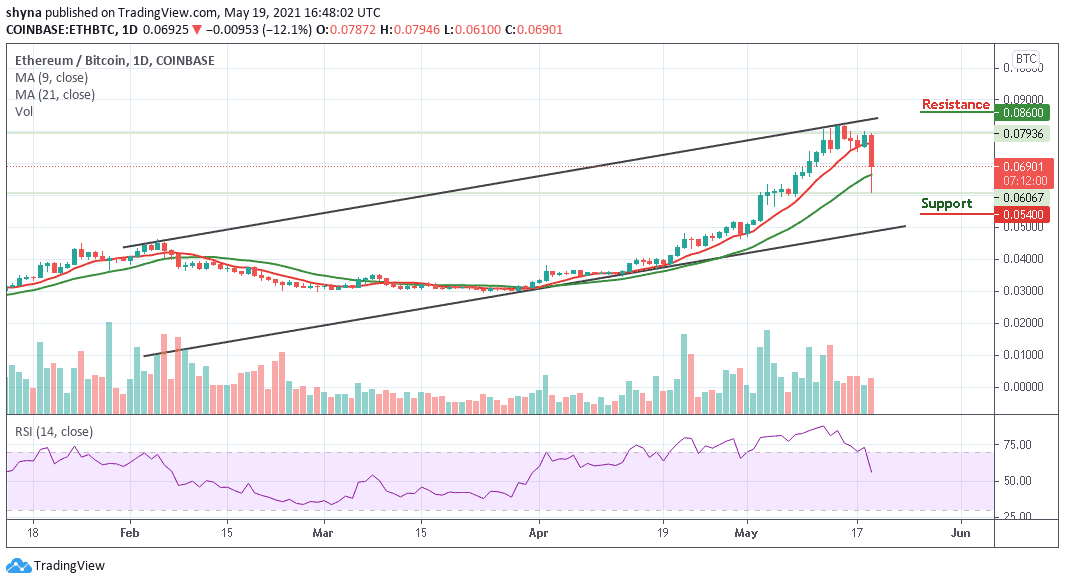
When observing the technical indicator, Ethereum signaled a downward movement and with this, sellers can take the market to the support levels of 5400 SAT and below. However, if the buyers were successful in pushing the market back above the 9-day and 21-day moving averages, the resistance level of 8600 SAT and above could be tested.
Join Our Telegram channel to stay up to date on breaking news coverage