Join Our Telegram channel to stay up to date on breaking news coverage
LTC Price Prediction – November 23
The LTC/USD has recovered above the lows of the day, but the rise remains slow. A sustainable movement above the $50 resistance level is needed to stimulate recovery.
LTC/USD Market
Key Levels:
Resistance levels: $52, $54, $56
Support levels: $40, $38, $36

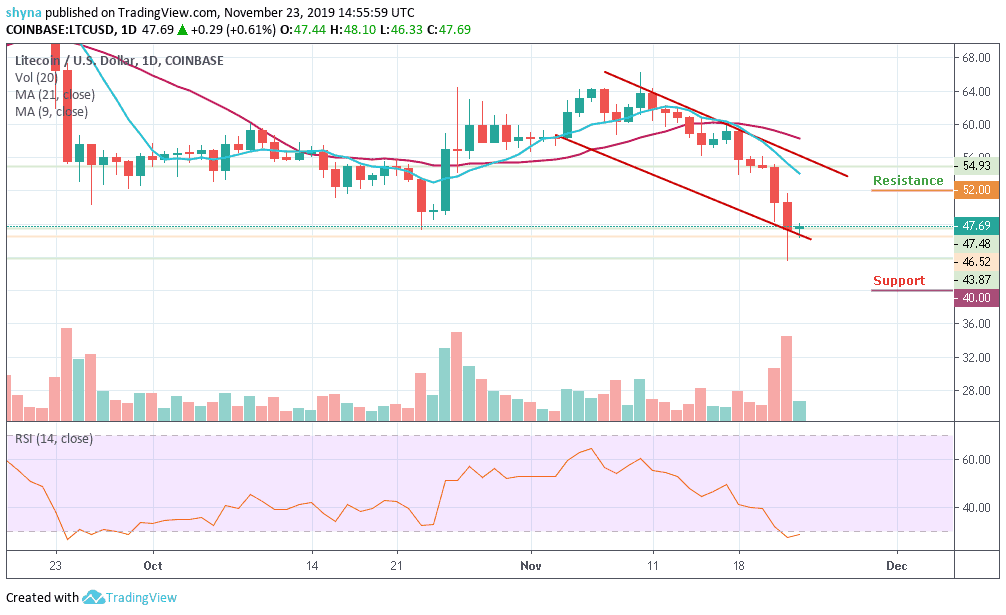
Litecoin bottomed out at $46.52 and managed to recover towards $47.69 as at the time of writing. However, the sixth-largest digital asset is now gaining nearly 3.37% since the beginning of the day. Meanwhile, LTC/USD is stuck in the short-term downtrend against rising volatility, synchronizing with the rest of the market.
However, looking at the daily chart, it can be seen that the Litecoin could not exceed the $48 level at the moment and had fallen to a support level of $46. The price tried to recover from touching the mentioned-level to move to where it is now, but the bulls will need to struggle to make an upward movement above the 9-day moving average before reaching the 21-day moving average.
Moreover, Litecoin bears managed to push the price well below a critical $50 level at the lower boundary of the channel under the 9-day and 21-day moving average. To follow the RSI (14) signal, a possible downward swing is likely to meet the support at $40, $38 and $36 levels. On the upside, a sustainable recovery above $50 which could advance the coin to a high of $52, $54 and $56 resistance levels are needed to mitigate the immediate bearish pressure.
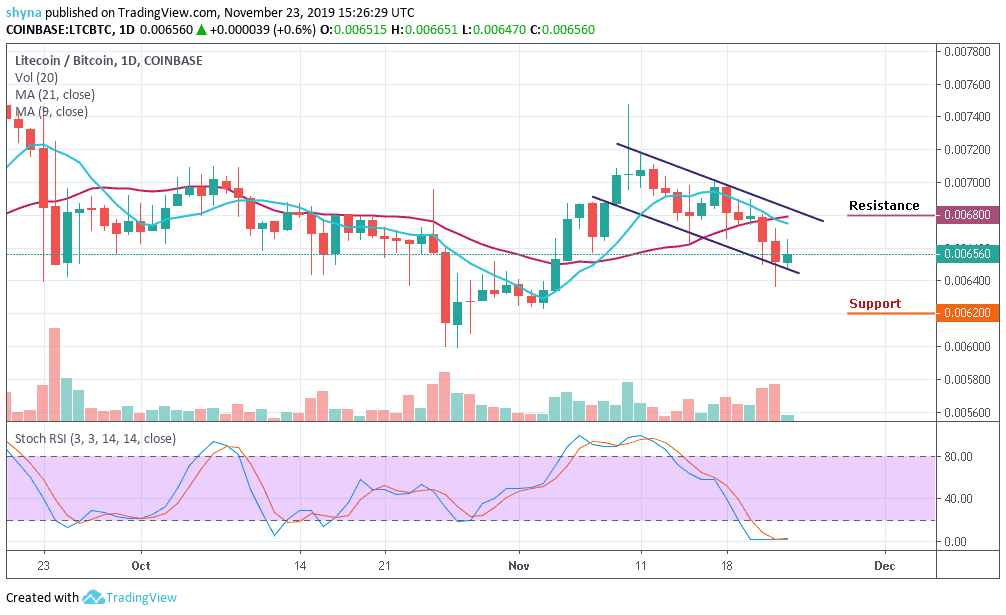
Against Bitcoin, Litecoin price is moving down slowly below the moving averages of 9-day and 21-day and at the lower boundary of the descending channel; for now, the bulls are making effort to push the price towards the north, currently trading at 6560 SAT. In other words, the sellers are still putting a serious downward pressure into the market.

However, the nearest key supports lie at 6200 SAT, 6100 SAT and 6000 SAT in a subsequent move. Similarly, an upward movement above the moving averages is likely to find immediate resistance at 6800 SAT and above. Meanwhile, the stochastic RSI is convincingly at the oversold zone and as it stands now, the bears are gaining control of the market.
Please note: Insidebitcoins.com is not a financial advisor. Do your research before investing your funds in any financial asset or presented product or event. We are not responsible for your investing results.
Join Our Telegram channel to stay up to date on breaking news coverage


