Join Our Telegram channel to stay up to date on breaking news coverage
Litecoin (LTC) Price Prediction – September 28
The LTC/USD price has dropped from $57.29 to $55.12 within 24 hours. The RSI indicator (14) is oriented at the edge of the oversold zone.
LTC/USD Market
Key Levels:
Supply levels: $80, $85, $90
Demand levels: $40, $35, $30
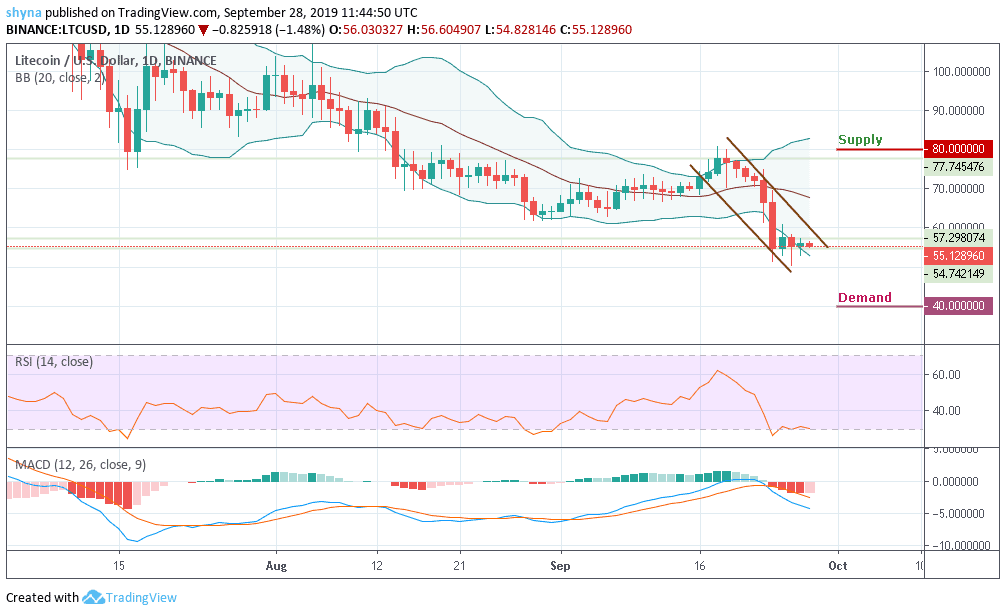
As LTC/USD ranges at the lower boundary of the Bollinger bands and within the descending channel, the $55 demand level may be penetrated by the bears provided there is an increase in the bears’ momentum and the price may fall to the previous low of September 26, 2019 which is $50.65 demand level. In case the $55 demand level holds, there could be a reversal and the price may begin a bullish movement.
Looking at the daily chart, LTC/USD is bearish and the pair may break down the former $54.74 demand level of two days ago. The bears hold the LTC/USD market and the MACD has swung back in the negative zone following the past few hours of severe drops, suggesting a bearish action in the market. The price may continue to decline towards the critical demand levels of $40, $35 and $30.
Currently, the price is testing the $54.12 level following the recent drop. However, the market may likely bounce higher to $65 and $70 supply level but the potential supply to watch for are $80, $85 and $90 levels. For now, Litecoin price is on a downward range and there’s a high probability for a break than a bounce.
Against Bitcoin, Litecoin (LTC) is moving in sideways within the descending channel since 2 days ago and the price is currently trading at 6770 SAT. With volume accumulating on the price chart, the price may likely fall to 6424 SAT before reaching the 5900 SAT and 5800 SAT demand levels.
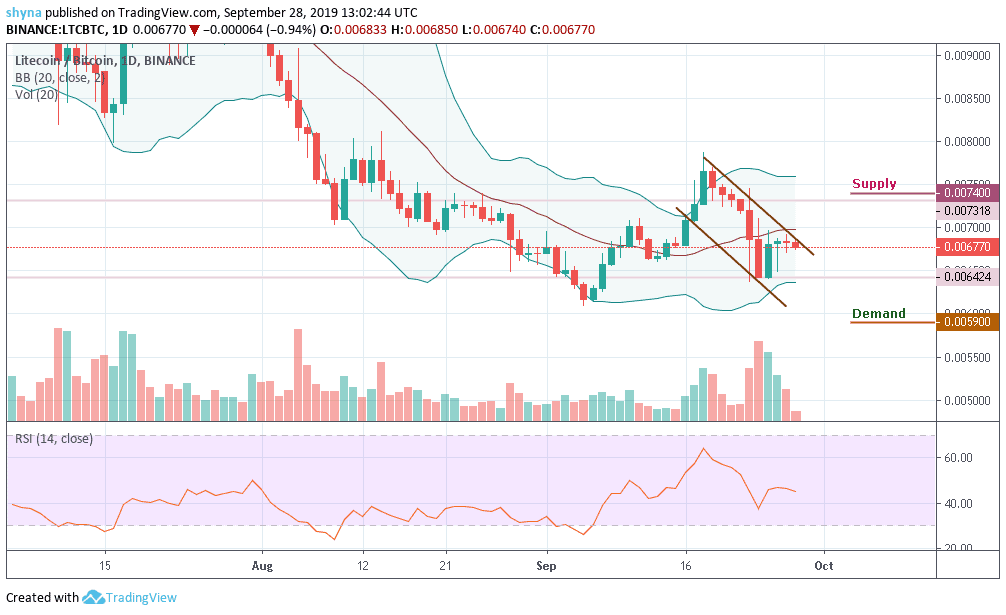
However, the RSI (14) is currently fighting at 50 level, which indicates indecision in the market. However, for LTC/BTC to increase and move towards the supply levels of 7400 SAT and 7500 SAT, the RSI indicator will need to go above the level-50 to show that the bulls dominate the market momentum.
Please note: Insidebitcoins.com is not a financial advisor. Do your research before investing your funds in any financial asset or presented product or event. We are not responsible for your investing results.
Join Our Telegram channel to stay up to date on breaking news coverage