Join Our Telegram channel to stay up to date on breaking news coverage
Litecoin Price Prediction – October 15
The Litecoin price moves down to touch the daily low of $176 within the market and its sell-offs may be extended below the 9-day moving average.
LTC/USD Market
Key Levels:
Resistance levels: $200, $210, $220
Support levels: $160, $150, $140
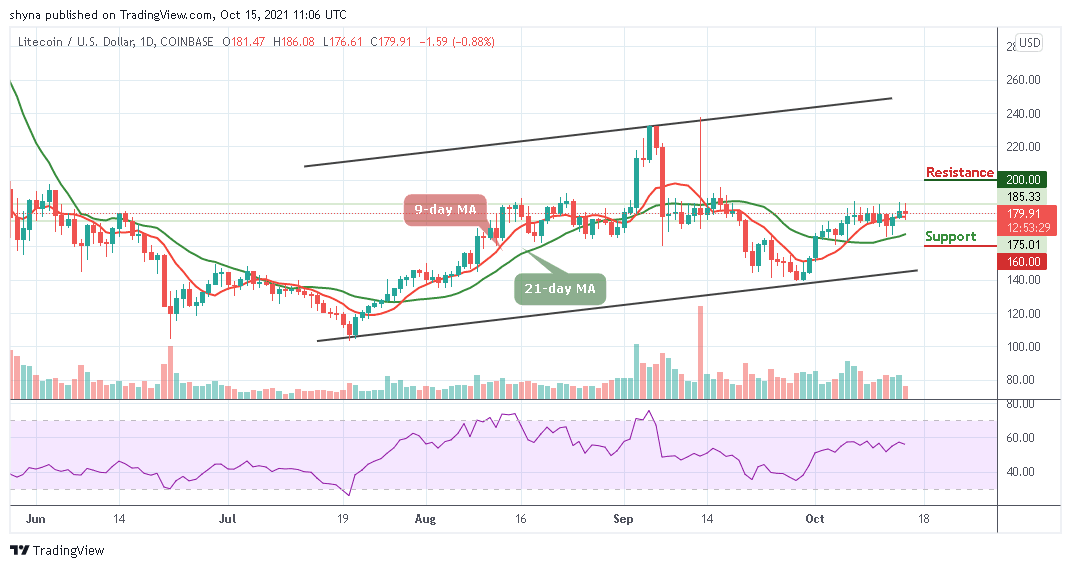
LTC/USD is changing hands to $179.91, down from the recent high of $186.08. The coin is moving synchronously around the 9-day moving average on the market. The Litecoin price is mainly influenced by speculative sentiment and technical factors, while fundamental developments remain in the shadows. The cryptocurrency market is known for its herd behavior because everything grows and falls simultaneously.
Litecoin Price Prediction: Litecoin (LTC) May Move Sideways
The Litecoin price remains above the 9-day moving averages as bulls couldn’t hold the ground. The wide-spread retracement on the market may push the coin below the 9-day moving average with the next local support at $175. This level is likely to limit the correction and serve as a jumping-off ground for another bullish wave.
However, the sell-off is likely to gain traction with the next focus on $160, $150, and $140 support levels. Meanwhile, on the upside, the initial resistance is created above the moving averages at $185. Traders may need to see a sustainable move above this level to test $190. The further bullish movement could touch the $200, $210, and $220 resistance levels despite the fact that the daily Relative Strength Index (14) moves below 60-leveL, suggesting bearish signals.
Against Bitcoin, the Litecoin price continue a tremendous downtrend, as the coin remains below the 9-day and 21-day moving averages. The bulls are making an attempt to push the market above the 9-day moving average but the technical indicator Relative Strength Index (14) is likely to cross into the oversold region. However, the critical support level is located around the 2800 SAT and below.
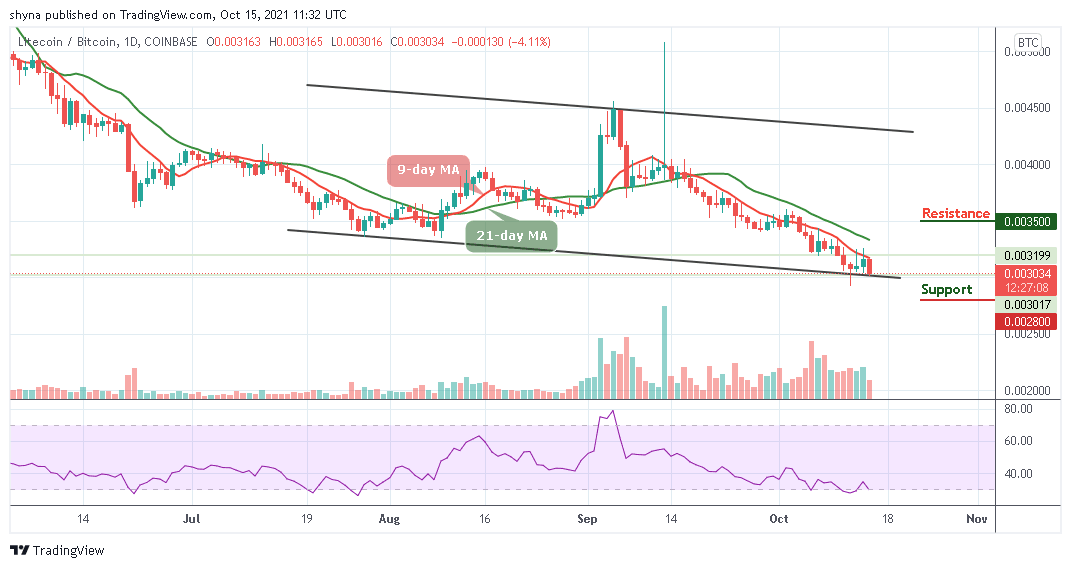
Moreover, if bulls begin to power the market, the coin may likely break above the 9-day and 21-day moving averages to find the potential resistance level at 3500 SAT and above. Meanwhile, the Litecoin price is currently changing hands to 33034 SAT and a spike in volatility may occur.
Looking to buy or trade Litecoin (LTC) now? Invest at eToro!
67% of retail investor accounts lose money when trading CFDs with this provider
Join Our Telegram channel to stay up to date on breaking news coverage