Join Our Telegram channel to stay up to date on breaking news coverage
ETH Price Prediction – April 26
Ethereum bulls push strongly towards the $200 resistance but were rejected at the same level.
ETH/USD Market
Key Levels:
Resistance levels: $225, $230, $235
Support levels: $165, $160 $155
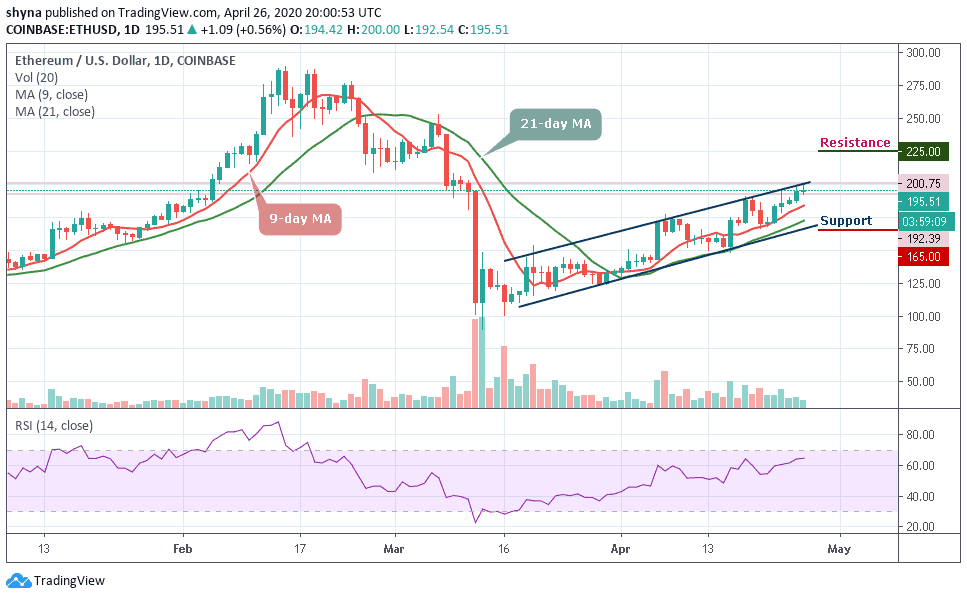
The recent bullish action of ETH/USD failed to sustain gains above $200 level, although a high was achieved at $200.75. For the past few days, Ethereum has been maintaining an uptrend. Currently, the coin is trading at $195.51 after adding 0.56% onto its value on the day. The strength of the Ethereum (ETH) is opening the door for a massive recovery movement targeting $200.
From a technical perspective, ETH/USD is capable of tackling the hurdles towards $200 as the RSI (14) shows that the crypto is not yet overbought. Therefore, the bulls still have room for growth in the short term. Moreover, the Ethereum price is gaining bullish momentum from the $170 support as the price surged above the 9-day and 21-day moving averages.
Looking at the daily chart, if the bulls can have a clear break above the $200 resistance level in the coming sessions, the resistance levels of $225, $230, and $235 may come into play. On the downside, the previous resistance near $192 is likely to act as a buy zone but if there is a fresh decline below this level, the coin may reach the key support at $165, $160, and critically $155 level.
Against Bitcoin, the market price remained in the ascending movement since April 2, currently trading at the level of 2557 SAT and expecting a break out above the channel. Looking at the daily chart, we can see that the coin continues to move above the 9-day and 21-day moving averages.
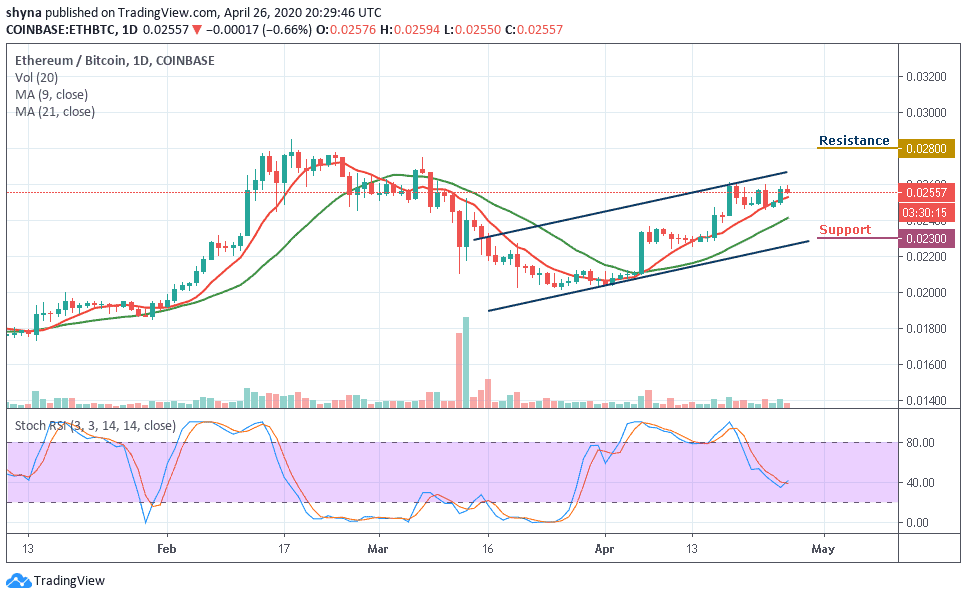
Similarly, further bullish movement may reach the next key resistance levels at 2800 SAT and above. However, on the downside, a possible drop could bring the market below the moving averages which may likely hit the support levels at 2300 SAT and 2200 SAT. According to the stochastic RSI, the signal lines move around 40-level.
Please note: Insidebitcoins.com is not a financial advisor. Do your research before investing your funds in any financial asset or presented product or event. We are not responsible for your investing results.
Join Our Telegram channel to stay up to date on breaking news coverage