Join Our Telegram channel to stay up to date on breaking news coverage
Bitcoin (BTC) Price Prediction – April 26
The Bitcoin price rests above $7,600 after the retreat from levels $7,491 but $8,000 may likely come out as the next vital resistance level.
BTC/USD Long-term Trend: Bullish (Daily Chart)
Key levels:
Resistance Levels: $8,400, $8,600, $8,800
Support Levels: $6,700, $6,500, $6,300

BTC/USD started the month at around $6,400 and now trades at $7,515 as at the time that the market opens today, charting notable increases throughout the entire week. In the past 24 hours alone, the coin has gained another 1.08% to its value, increasing from around $7,515 to about $7,714 from where it retraced a bit and currently trading above the 9-day and 21-day moving averages at $7,629.
Nevertheless, a further retracement seems imminent and it is likely to break below $7,500. Meanwhile, looking at the chart, $6,700, $6,500, and $6,300 serve as the major support levels, making room for the coin to fall even further. The technical indicator RSI (14) is seen moving above 60-level, suggesting more bullish movements as long as the 9-day MA signal line is above the 21-day MA.
However, as the daily chart reveals, if the bulls continue to put more effort and push the price towards the upper boundary of the channel, BTC/USD may see the next resistance level at $8,200, any further movement above the channel could send it to the potential resistance levels of $8,400, $8,600 and $8,800 respectively as the technical levels remain positive.
BTC/USD Medium – Term Trend: Ranging (4H Chart)
Looking at the 4-hour chart, BTC/USD is clearly facing a lot of resistance near the $7,700 and $7,800 level. A successful close above the $7,800 level is a must for bullish acceleration. If not, there is a risk of a downside extension below the $7,500 support. If there is a downward move, initial support is near the $7,200 level and the main support is near the $7,300 level and below.
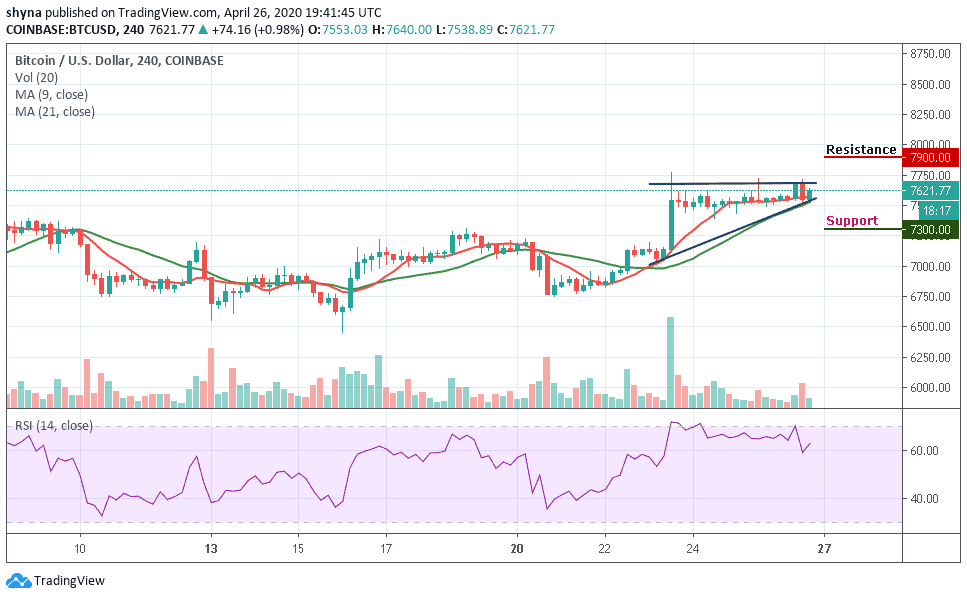
However, if there are more gains, the $7,700 level is likely to act as a major hurdle in the near term for Bitcoin. So if there is an upside break above the $7,700 resistance, the next stop for the bulls may perhaps be near the $7,900 resistance levels and above as the RSI (14) is moving above 60-level, after the market has experienced a sideways movement.
Please note: Insidebitcoins.com is not a financial advisor. Do your research before investing your funds in any financial asset or presented product or event. We are not responsible for your investing results.
Join Our Telegram channel to stay up to date on breaking news coverage