Join Our Telegram channel to stay up to date on breaking news coverage
Ethereum Lowering in Values – May 22
Ethereum Price Prediction shows that there has been a strong dominance of downward pressure in the ETH/USD trade worth over some trading days’ sessions now.
The US Dollar depresses the crypto’s value failed to make an upward swing during a downward correction to a lower point between levels of about $32,000 and $36,000. The market now trades around the rate of -16.27% decreases at the level of about $2,322.
Lowering in Values: ETH Market
Key Levels:
Resistance levels: $2,800, $3,300, $3,800
Support levels: $1,800, $1,600, $1,400
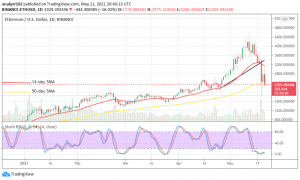
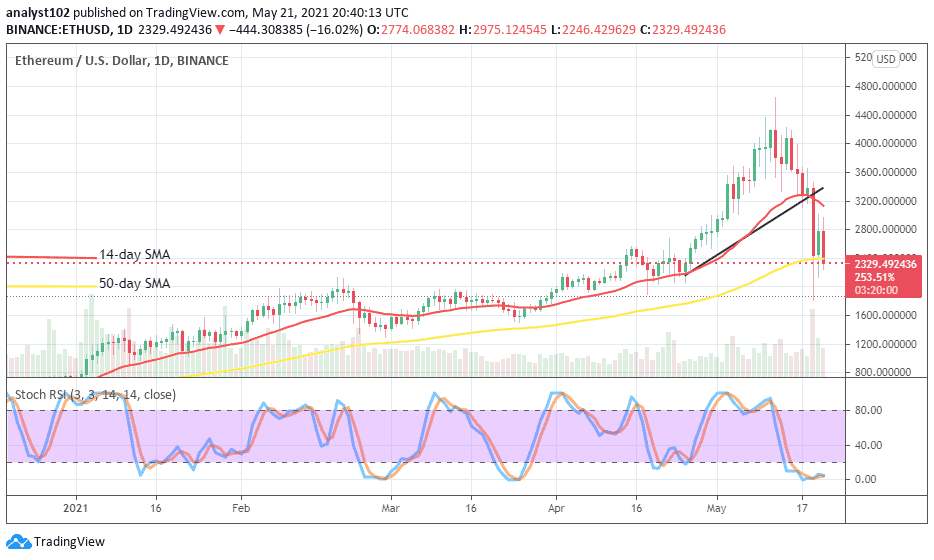
ETH/USD – Daily Chart
The ETH/USD chart shows that there is a pressure mounting against the trend-line of 50-day SMA to the south. There may now soon be a convergence of variant candlesticks around the point of $2,400 to possibly create a range-bound price movement in the near market’s session.
The 14-day SMA has crossed the bullish trend-line drew from the top to point to the south far above the 50-day SMA indicator. The Stochastic Oscillators are with conjoined hairs in the oversold region moving in a consolidation manner. That as well indicates ongoing down-turning pressures still exist in the crypto economy.
Where will ETH price reach as it is lowering in values ?
Going by the current rate of downward pressure in the ETH/USD market operations, it is most probable that the level of around $3,200 will be a tougher zone against the quick recovery of the crypto’s price.
It appears that less or slow pulling-ups toward the point will mostly be rejected. Therefore, it may take a while when a sudden bullish may emerge to break it northwardly to be able to signify a reliable return of an uptrend in the market.
It is now devoid of any doubt that the Ethereum market is on a higher note of risking losing so much more of its previously achieved profits to the current fearful downward forces imposed by bears.
That said, the point at which the 50-day SMA indicator is located around the $2,400 level is poised to play an important role in deciding the next trade’s direction. Bears need holding stronger against at that point. Meanwhile, bulls also need building up supports around the line. A further breakdown devoid of reverse will put bears on a winning format afterward.
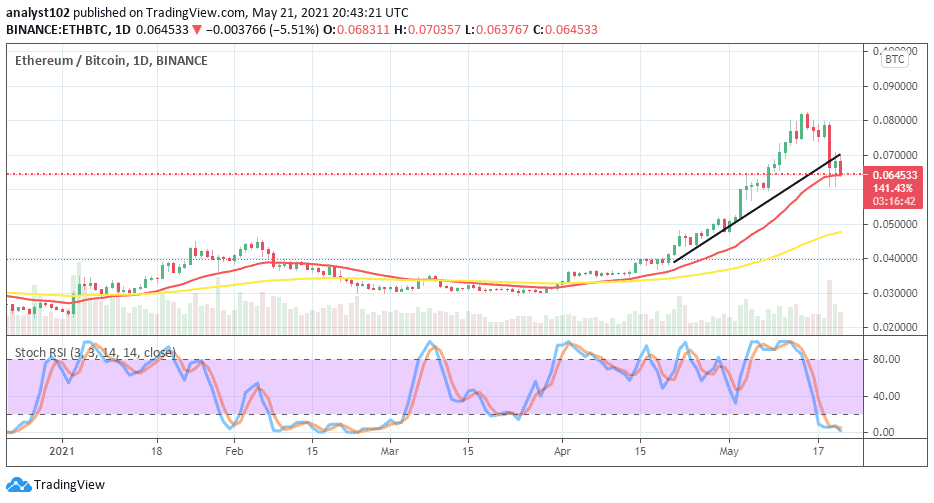
ETH/BTC Price Analysis
Despite a major fall-off in the crypto economies, the ETH/BTC chart yet shows that the trend is in a favor of the base trading instrument as placed with the chief counter trading tool.
The reason for that is that the market operation between the two most famous instruments has only been in a correctional moving manner to find a place around the smaller trend-line that is still pointing towards the north.
Likewise, the 50-day SMA indicator is far placed below it pointing to the north also. The Stochastic Oscillators are dipped in the oversold pointing slightly to the south to indicate that there may still be some degree of down moves against the Ethereum market’s position in the near session.
Looking to buy or trade Ethereum (ETH) now? Invest at eToro!
75% of retail investor accounts lose money when trading CFDs with this provider
Join Our Telegram channel to stay up to date on breaking news coverage