Join Our Telegram channel to stay up to date on breaking news coverage
Bitcoin Price Prediction: Battling at Resistance – May 26
There has been a continual process in which the BTC/USD struggles at $40,000, as it keeps being rejected at that resistance level. The price is currently at $39,81 for a 4.67% appreciation.
Trade Struggles Rebounding: BTC Market
Key Levels:
Resistance levels: $45,000, $50,000, $55,000
Support levels: $35,000, $30,000, $25,000
BTC/USD – Daily Chart
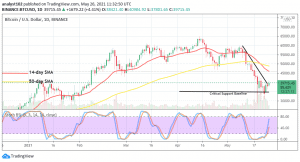
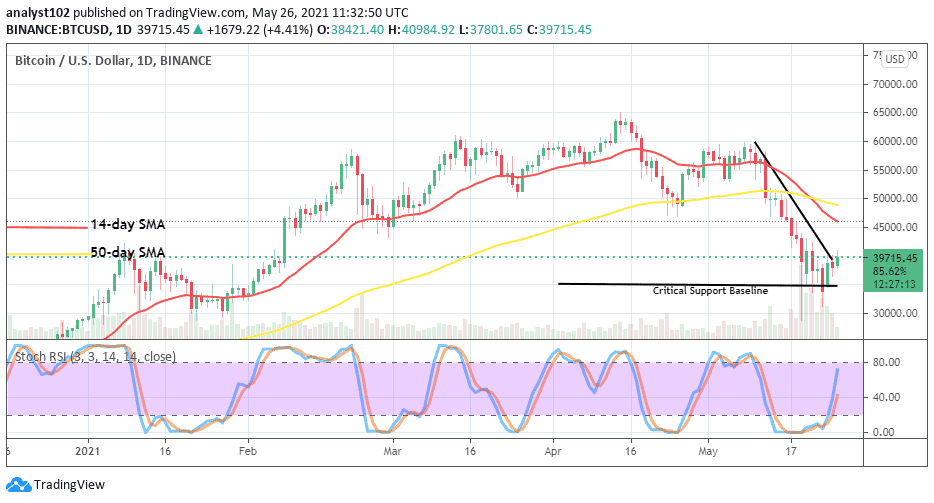
The daily chart shows the BTC/USD price struggling to clear key resistance at $40,000. The market is having great difficulty in retracing to the upside by building momentum for an upswing.
The bearish trend-line has not convincingly breached northbound, as it is closely drawn down to signify the point that the current rebounding movement has reached.
The 50-day SMA indicator has been intercepted from the above by the 14-day SMA trend-line. And, they are both above the bearish trend-line. The Stochastic Oscillators have swerved higher to a position between the 40 and 80 range, suggesting an upward move is ongoing.
Bitcoin price prediction: BTC/USD trade struggles to rebound
As the Bitcoin versus USD trade battles at the key resistance area of $40,000, a candlestick is forming. And, until the end of today’s session, it may still be difficult to project a definite direction that the candlestick will favour.
With that said, it is most likely that it will be in line with the upside. With that perspective, bulls should be able to push the market further to break through some of the overhead resistance. But, there may be a pit stop around $45,000 thereafter.
The present situation makes it technically somewhat difficult for bears to stage a smooth sell entry on BTC/USD. As a result, bears will now have to cautiously wait for a strong sell signal to resurface in this market. Following any future price rejection at the $40,000 level, there could be a closing off of sell-trading positions in the process.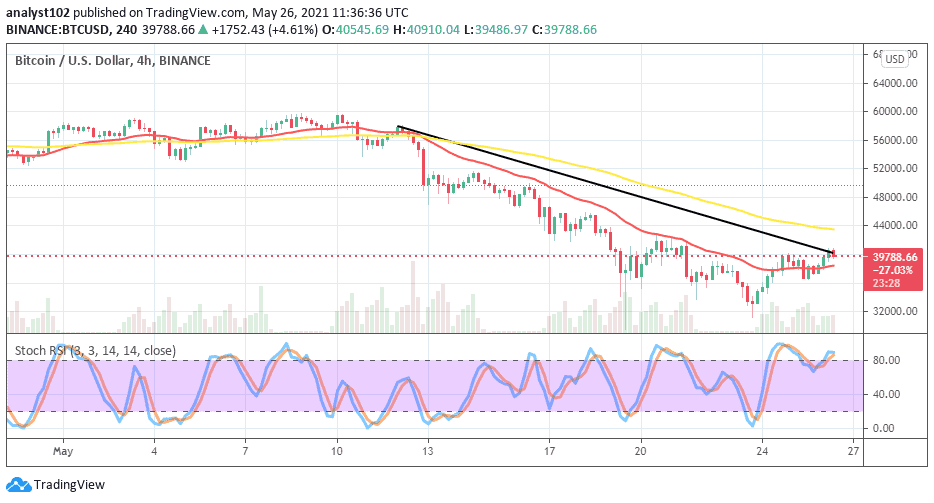
BTC/USD 4-hour Chart
Bitcoin and the USD trade struggles to find direction on the medium-term chart. The 14-day SMA trend-line has briefly traded below its bearish trend-line, making it the location reached by the rebounding price.
The 50-day SMA is situated above them bending toward the south. The Stochastic Oscillators are around 80 in the overbought region, moving in a consolidation manner. They have now closed the hairs slightly above 80. That suggests that the crypto market is in a less-active trading position. Therefore, indecision may now set in for a while.
Looking to buy or trade Bitcoin (BTC) now? Invest at eToro!
75% of retail investor accounts lose money when trading CFDs with this provider
Join Our Telegram channel to stay up to date on breaking news coverage