Join Our Telegram channel to stay up to date on breaking news coverage
Bitcoin Price Prediction – July 17
After falling from $31,949 to $31,179, the Bitcoin price now manages to hold onto the critical support level of $31,000.
BTC/USD Long-term Trend: Bearish (Daily Chart)
Key levels:
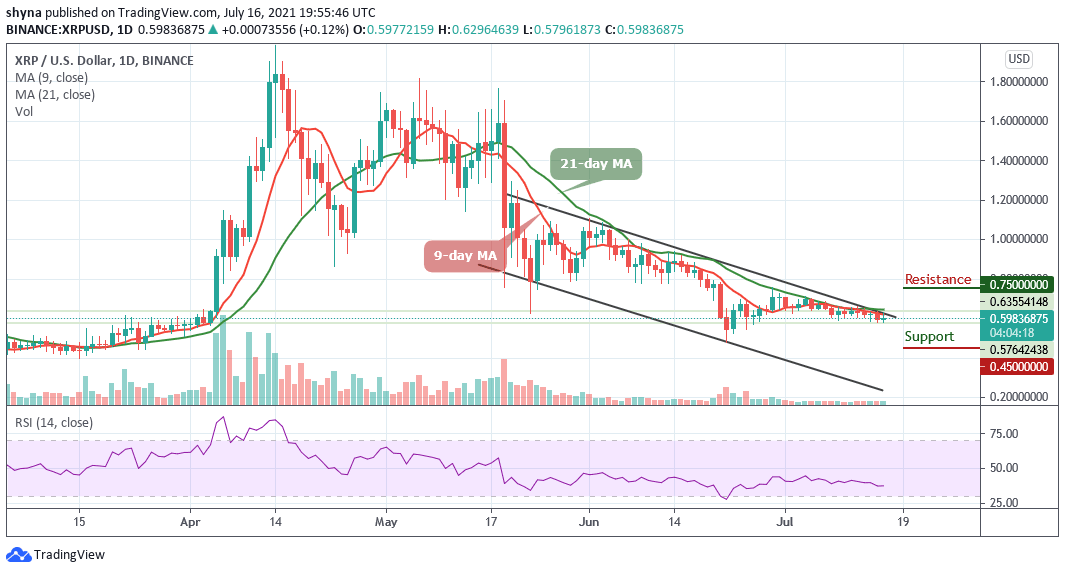
Resistance Levels: $36,000, $38,000, $40,000
Support Levels: $28,000, $26,000, $24,000

BTC/USD is seen trading at $54,607 after soaring to $54,819 in the early hour of today’s trading. The first digital asset is also seen pulling back to where it is currently trading and could head downwards if the bears step back into the market. Meanwhile, the breaking of the crucial support could mean the resumption of the downtrend while the holding of the $31,000 support will mean the continuation of the range-bound movement. More so, the upside momentum may resume if buyers breach crucial resistance levels above $35,000.
Bitcoin Price Prediction: Bitcoin Price Keeps Moving Sideways
The Bitcoin price may continue to seek entry during a reversal movement time as the market level at $31,000 remains the baseline for support. However, on the downside, the Bitcoin bears still have the likely tendency to push the market down to the immediate support level of $30,000 in the long term. Furthermore, a sudden and sharp breakout of the point can lead the bears into a trap in no time.
Nevertheless, if the market price moves above the 9-day and 21-day moving averages, it may signal a jump towards $35,000 while breaking down could lead the king coin to the immediate support level of $30,000. Meanwhile, the continuation of the bullish movement may locate the potential resistance levels of $36,000, $38,000, and $40,000 as the supports lie at $28,000, $26,000, and $24,000. The technical indicator Relative Strength Index (14) may cross above 40-level to aids the bullish movement.
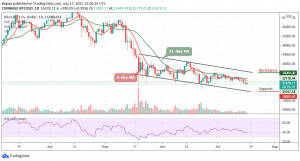
BTC/USD Medium – Term Trend: Bearish (4H Chart)
The Bitcoin price is now trading around $31,625 after rebounding from $31,346. Looking at the 4-hour price chart, we can see that the bullish supply is coming up slowly in the market, but the bears are also keeping the price below the 9-day moving average. Meanwhile, the $30,500 support level and below may come into play if BTC heads to the south.

However, if buyers can gather more momentum, they can push the market price above the 9-day and 21-day moving averages to retest the resistance level of $32,000. Therefore, breaking the mentioned resistance could also allow the bulls to test the $32,500, and above as the Relative Strength Index (14) is likely to move above 45-level.
Looking to buy or trade Bitcoin (BTC) now? Invest at eToro!
75% of retail investor accounts lose money when trading CFDs with this provider
Join Our Telegram channel to stay up to date on breaking news coverage