Join Our Telegram channel to stay up to date on breaking news coverage
Ripple Price Prediction – July 16
The Ripple price prediction is seen recovering from the intraday low of $0.57 amid the improved market sentiments.
XRP/USD Market
Key Levels:
Resistance levels: $0.75, $0.80, $0.85
Support levels: $0.45, $0.40, $0.35
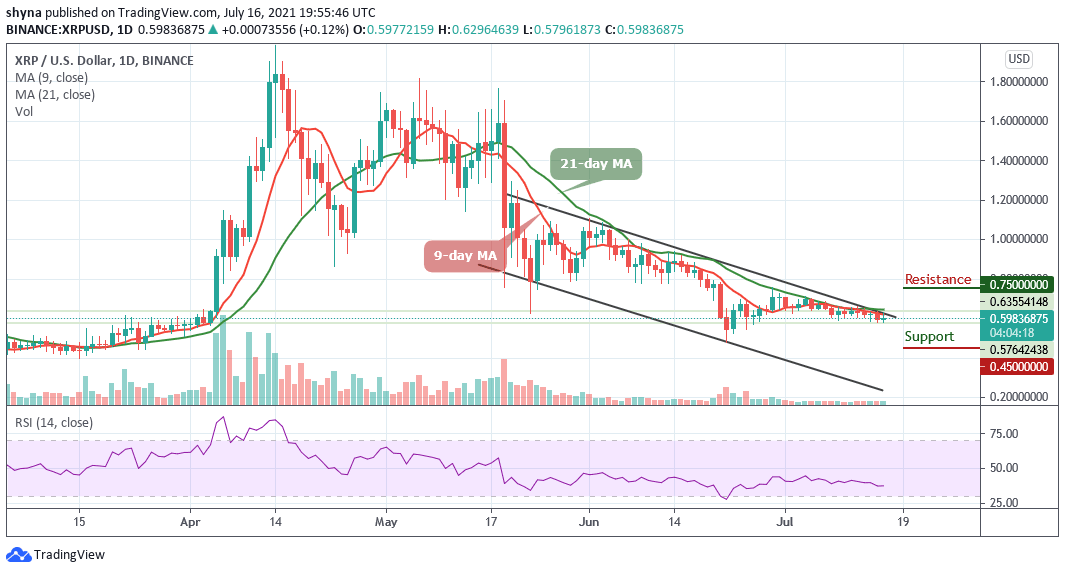
XRP/USD regains ground after a severe sell-off to $0.57 during the early Asian hours of today. Currently, the Ripple price is changing hands at $0.59 as it is up by 0.12% since the start of the day. Despite the recovery, the coin is still lower from this time of yesterday. Ripple now takes sixth place in the global cryptocurrency market rating, with the current market capitalization of $27.6 billion.
Ripple Price Prediction: Ripple Price May Test $0.60 Again
The Ripple price hits hard by the recent market-wide sell-off, with the cryptocurrency’s price erasing the vast majority of the gains that it has been able to gain over the past few months. Meanwhile, a sustainable move above $$0.60 is needed to improve the technical picture and set the bullish ball rolling for the coin as this resistance level has been tested but each time, the bulls always backed off.
The daily chart shows that the price recovery is capped by the 9-day moving average. This technical line has been tested as support on several occasions. Once it is out of the way, the upside is likely to gain traction with the next focus towards the resistance levels of $0.75, $0.80, and $0.85. The support levels could be found at $0.45, $0.40, and $0.35 respectively as the technical indicator Relative Strength Index (14) keeps moving sideways.
When compares with Bitcoin, the Ripple keeps moving around 1875 SAT around the 9-day and 21-day moving averages. After the coin touches the daily high at 1952 SAT today, the coin later retreated back below the 21-day moving average. Meanwhile, the price keeps moving sideways as the sellers continued to put pressure on the market.
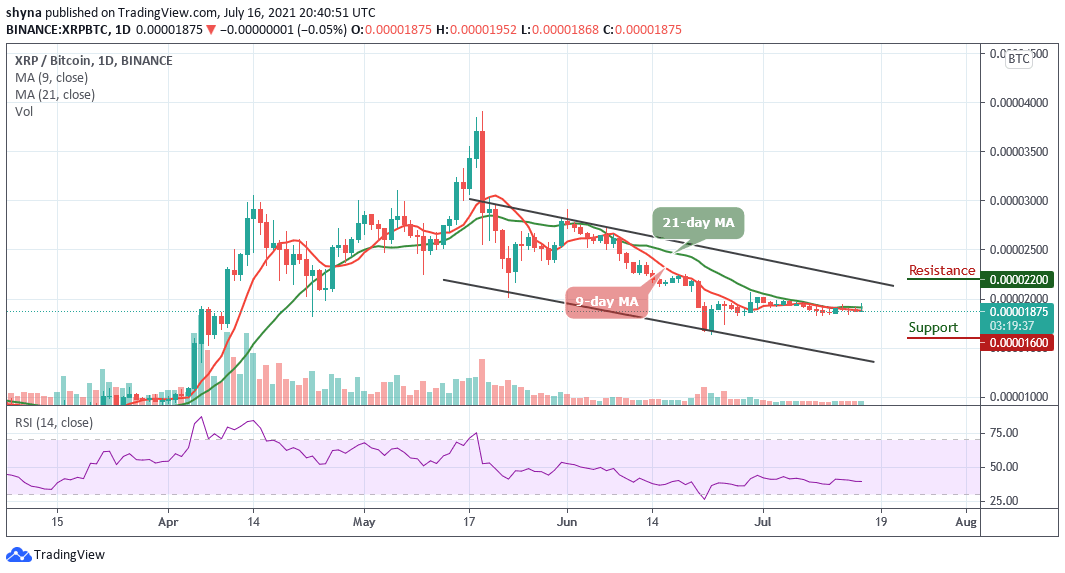
However, if the sellers put more pressure, the Ripple price may drop to 1600 SAT and below. At the moment, the technical indicator Relative Strength Index (14) moves around the 40-level as the market remains at the downside of the channel while the resistance levels are located at $2200 and above.
Looking to buy or trade Ripple (XRP) now? Invest at eToro!
75% of retail investor accounts lose money when trading CFDs with this provider
Join Our Telegram channel to stay up to date on breaking news coverage