
Join Our Telegram channel to stay up to date on breaking news coverage
Ripple Price Prediction – July 14
The Ripple price is seen dropping below the 9-day and 21-day moving averages after touching the resistance level of $0.62.
XRP/USD Market
Key Levels:
Resistance levels: $0.80, $0.85, $0.90
Support levels: $0.45, $0.40, $0.35
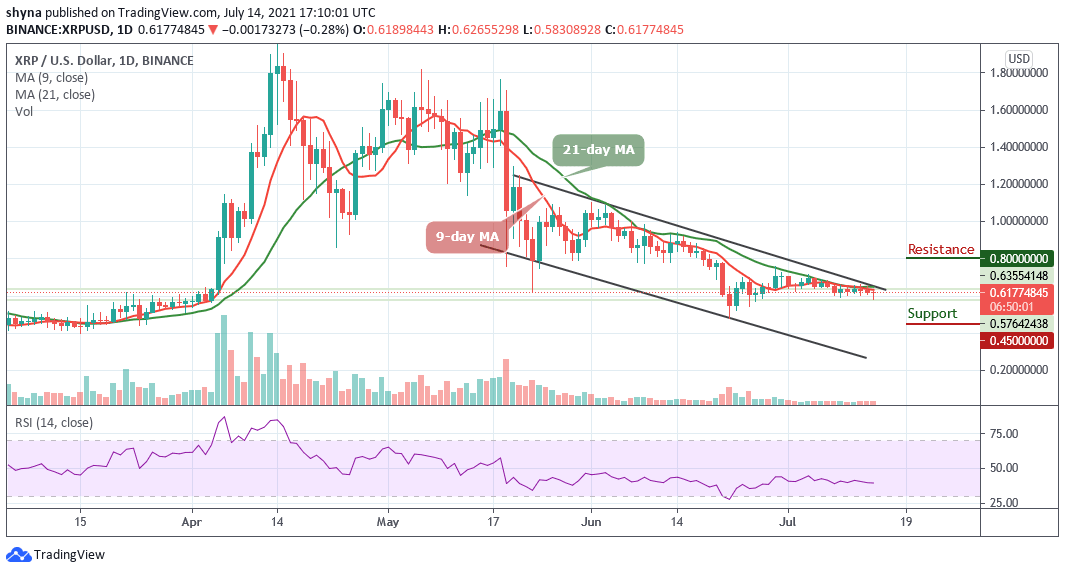
After falling below $0.62, XRP/USD could continue to show price weakness until the market finds stable levels to reinforce a bull run above the upper boundary of the channel. Meanwhile, a new low has yet to be determined as the bears have remained dominant and active for the past few days. Therefore, traders may need to wait for sellers to run out of momentum before craving, and shorting Ripple (XRP) might be the best position right now.
Ripple Price Prediction: Would Ripple (XRP) Retest $0.65 Level?
As the Ripple price moves sideways and the market finally resumes selling, XRP/USD may continue to trade below the 9-day and 21-day moving averages and if this continues before Ripple (XRP) get to the lower boundary of the channel, it could find immediate support at $0.50 while critical supports are located at $0.45, $0.40 and $0.35. Furthermore, the Ripple (XRP) has continued to erode bearish in the daily time frame.
In other words, a bullish rally may need to confirm if the market can climb significantly above the 9-day and 21-day MAs at $0.65. Meanwhile, the technical indicator Relative Strength Index (14) is currently moving around 40-level, suggesting more sideways movement. Therefore, if the Ripple price manages to surge above the upper boundary of the channel, it may see the resistance levels at $0.80, $0.85, and $1.90.
Against Bitcoin, the pair is consolidating around below the 9-day and 21-day moving averages. However, the buyers may need to push the price upward for it to hit the resistance levels of 2200 SAT and 2400 SAT respectively.

Moreover, if the bulls failed to push the price upward, the Ripple price may drop towards the lower boundary of the channel and the nearest support levels are located at 1500 SAT and 1300 SAT. On the contrary, the technical indicator Relative Strength Index (14) is moving in the same direction around 41-level, suggesting sideways movement for the coin.
Looking to buy or trade Ripple (XRP) now? Invest at eToro!
75% of retail investor accounts lose money when trading CFDs with this provider
Join Our Telegram channel to stay up to date on breaking news coverage
