Join Our Telegram channel to stay up to date on breaking news coverage
Bitcoin Price Prediction – July 3
The Bitcoin price is showing stability above $34,000 as traders are waiting for the next big move.
BTC/USD Long-term Trend: Ranging (Daily Chart)
Key levels:
Resistance Levels: $40,000, $42,000, $44,000
Support Levels: $29,000, $27,000, $25,000

BTC/USD has been ranging between $31,000 and $35,000 for nearly a week after a shortfall from almost $36,675 seen late last month. Meanwhile, if the coin struggles to show any distinctive price movement, traders are generally cautious about this movement. However, over the medium to long term, many traders expect the Bitcoin price to recover and perceive the ongoing consolidation phase as a healthy pullback.
Bitcoin Price Prediction: Where is BTC Price Going Next?
So far, the Bitcoin price successfully stays above the $34,000 level and continues to trade above the 9-day moving average but still below the 21-day moving average. Recently, the coin even spiked to touch the daily high of $34,953 during the early trading session as the technical indicator Relative Strength Index (14) remains above the 45-level.
At the time of writing, it seems like BTC/USD might stay clear of the gap, with the cryptocurrency trading under its recent resistance level of $35,000. Meanwhile, from a technical perspective, the king-coin has to fight off the first resistance at $38,000 before having a chance to aim at $40,000, $42,000, and $44,000 resistance levels. On the contrary, any bearish movement below the 9-day and 21-day moving averages may likely lead to the critical supports at $29,000, $27,000, and $25,000.
BTC/USD Medium – Term Trend: Ranging (4H Chart)
There are several signs showing that Bitcoin (BTC) is poised for a significant move to the upside. However, the price action of the past few hours formed a bullish movement on the 4-hour chart which appears to have broken out with a decent move towards $34,800. Similarly, the Relative Strength Index (14) is notably squeezing, indicating that high volatility may come into play.
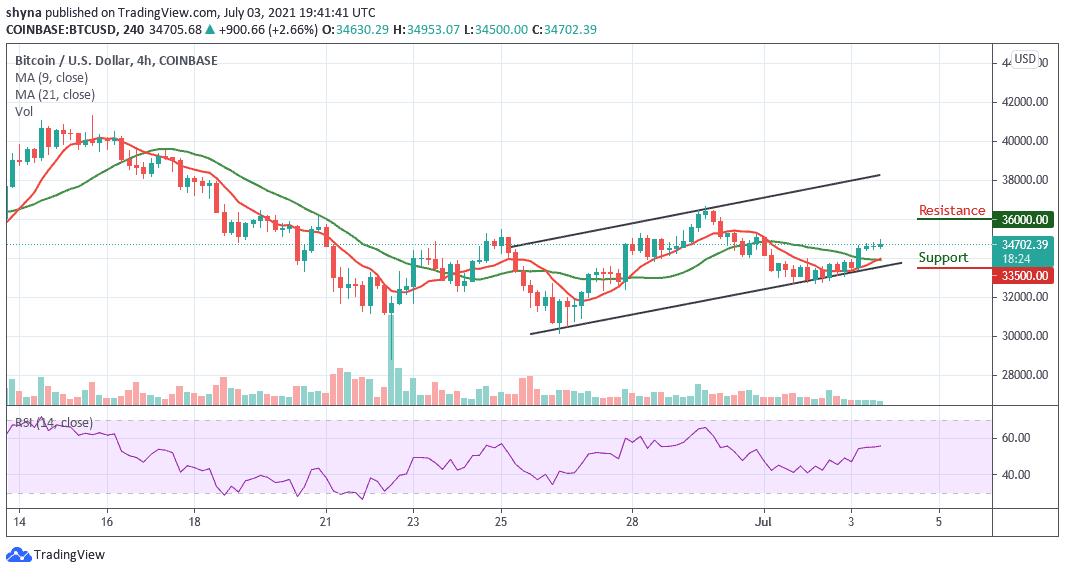
Meanwhile, the 9-day MA is making an attempt to cross above the 21-day MA and additional resistance levels could be achieved. However, a move above the $35,000 level with a strong close above it may likely push the Bitcoin price up to the resistance level of $36,000 and above while the support levels are located at $33,500 and below.
Looking to buy or trade Bitcoin (BTC) now? Invest at eToro!
75% of retail investor accounts lose money when trading CFDs with this provider
Join Our Telegram channel to stay up to date on breaking news coverage