Join Our Telegram channel to stay up to date on breaking news coverage
Ripple Price Prediction – July 3
For the past few days, Ripple (XRP) has been unable to develop the upside momentum above $0.75 as the coin remains at the downside.
XRP/USD Market
Key Levels:
Resistance levels: $0.95, $1.05, $1.15
Support levels: $0.40, $0.30, $0.20
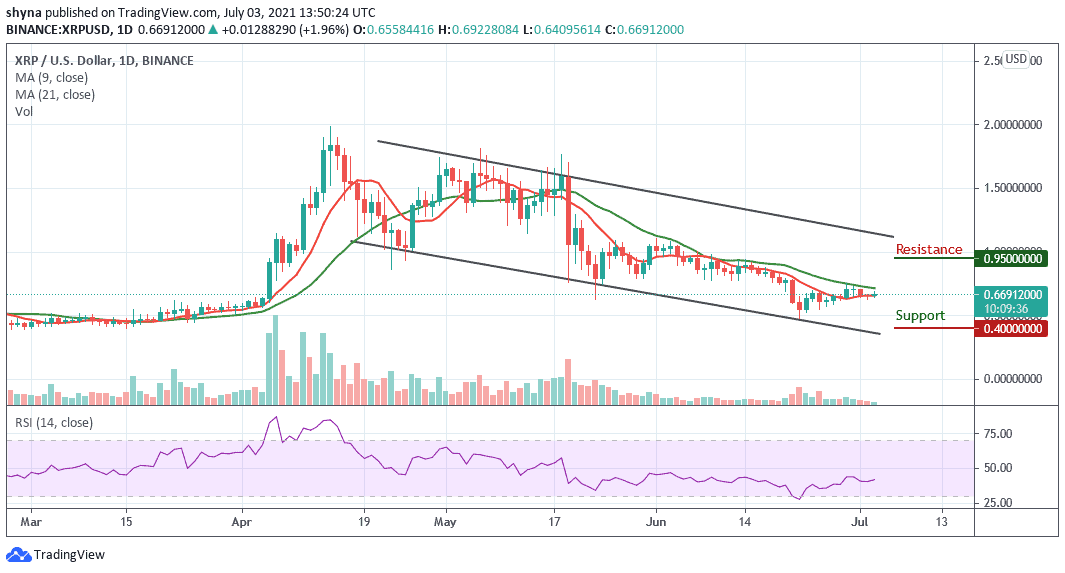
During the European session, XRP/USD trades above $0.65 but failed to hold the ground and retreated quickly towards $0.64. Nevertheless, the Ripple (XRP) has stayed mostly unchanged both on a day-to-day basis and since the beginning of today, XRP/USD now trades within the 9-day and 21-day moving averages but the sideways movement could limit its bullish movements.
Ripple Price Prediction: Price May Retrace Above $0.80
As the daily chart reveals, the Ripple price is seen hovering within the 9-day and 21-day MAs, and should the bulls manage to push the market price above this barrier; the coin may likely find the potential resistance levels at $0.95, $1.05, and $1.15. Meanwhile, if XRP/USD revisits the negative side, it may experience a bearish movement.
However, it is likely for the Ripple price to hit the nearest support at $0.50 and a further drop could pull the market to $0.40, $0.30, and $0.20 supports. Meanwhile, the technical indicator Relative Strength Index (14) is slowly moving below 45-level, which may more bearish signals into the market.
When compares with Bitcoin, the Ripple price is trading on the downside as the coin action remained intact within the 9-day and 21-day moving averages. However, if the selling pressure persists, Ripple (XRP) may likely create a new low in the next coming trading days.
However, the technical indicator Relative Strength Index (14) is seen moving in the same direction as traders may continue to see a negative move in the market soon. More so, the market can as well expect close support at the 1600 SAT by breaking below the lower boundary of the channel to hit the critical support of 1500 SAT and below.
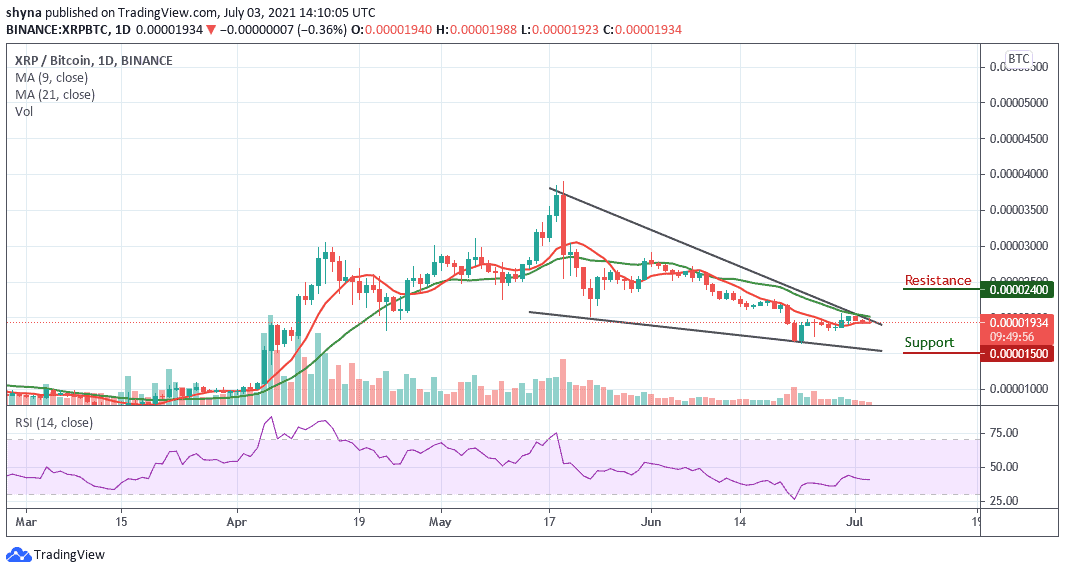
On the contrary, if a bullish move occurs and validates a break above the upper boundary of the channel; traders may confirm a bull-run while the closest resistance levels lie at 2400 SAT and above.
Looking to buy or trade Ripple (XRP) now? Invest at eToro!
75% of retail investor accounts lose money when trading CFDs with this provider
Join Our Telegram channel to stay up to date on breaking news coverage