

Join Our Telegram channel to stay up to date on breaking news coverage
- The current BTC price bull run as seen the big crypto bush shoulders with $55K.
- Bitcoin’s market capitalization has once again returned to over $1 trillion.
- The IOMAP shows that BTC sits on strong support around $53,200.
BTC price is trading at $54,329 with a bullish bias after rallying approximately 7.25% over the last 24 hours with a daily trading volume of $47,531,927,866 which has itself increased by 25% over the same period. Bitcoin price has surged more than 26% over the last seven days. This rally that began on September 30 has seen the bulls push the big crypto from a low of $41,444.58 on September 30 to brush shoulders with $55k on Wednesday.
This represents a rally of about 36% that has seen Bitcoin’s market capitalization increase by approximately 26% from $824,619,217,608 on September 30 to the current value around $1.025 trillion according to data from CoinMarketCap.
BTC Market Cap Chart
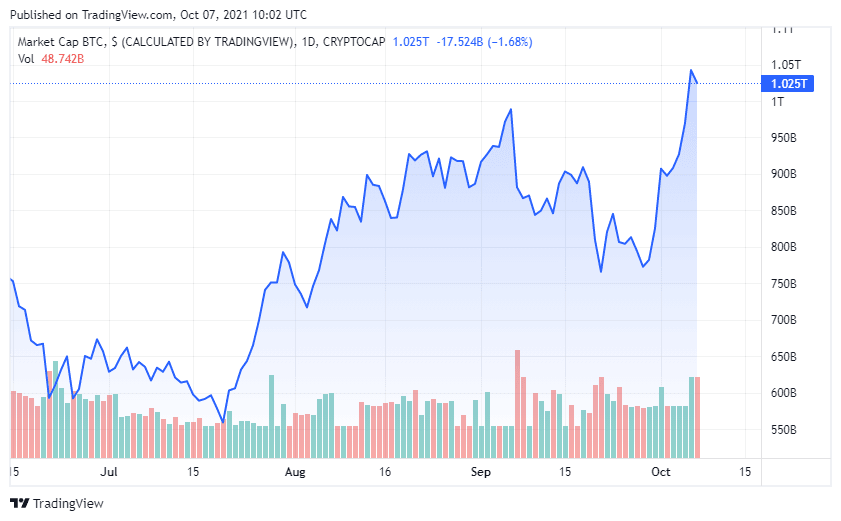
Bitcoin’s market cap took a breather at around $988 billion on September 06 before the BTC price plunged to below $43,000 during the September 07 crypto market flash crash.
This is the first time on five months that the market capitalisation of the flagship cryptocurrency has surged above the $1 trillion mark. The last time the BTC’s market value was above this mark was in May 11 at $1.062 trillion. Before then, Bitcoin’s market cap was oscillating above and the below the $1 trillion mark before May’s bearish leg.
BTC Price Sits On Strong Support Around $53,124
Technical indicators could bolster investors to buy Bitcoin as they show that BTC price sits on strong support at the moment.
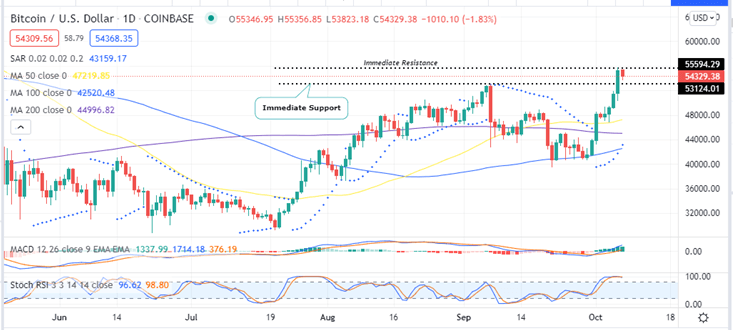
There are a number of factors that validate this outlook. To begin with, Bitcoin is sitting on strong support provided by the Simple Moving Averages (SMA) with the 50-day SMA at $47,218, 100-day SMA at $42,520 and the 200-day SMA at $44,996. These support areas are robust enough to keep Bitcoin bullish in the long-term.
In addition, BTC/USD price immediate support around the $53,124 area is strong and daily closure above this level could see big crypto rally towards he ATH which less than $10,000 away.
BTC/USD Daily Chart
This strong support is accentuated by data from IntoTheBlock’s In/Out of the Money Around Price (IOMAP) model which shows that BTC’s immediate support is robust. It is within the $52,550 and $54,128 price range where approximately $515,780 BTC were previously bought by approximately 712,990 addresses.
These investors might want to push the Bitcoin price higher in order to take profits at higher prices.
Bitcoin IOMAP Chart
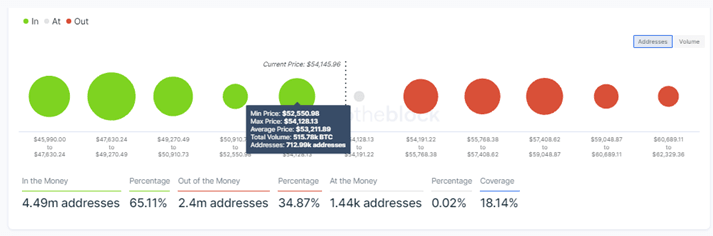
The same IOMAP chart shows that BTC price support downwards is very robust and that the path is with little resistance is upwards towards the ATH.
Enthusiasm among market participants, with longer-term BTC price projections are firmly bullish.
“Bitcoin finishing above its ATH would be super positive to keep pushing towards the inevitable,” tweeted David Gokhshtein, Founder and CEO PAC Protocol.

However, if things go awry for the Bitcoin bulls, we could see a retracement for BTC price to $45,000 or even $40,000 should the bellwether cryptocurrency retest all-time highs following the current rally.
Looking to buy or trade Bitcoin (BTC) now? Invest at eToro!
67% of retail investor accounts lose money when trading CFDs with this provider
Read More
Join Our Telegram channel to stay up to date on breaking news coverage