Join Our Telegram channel to stay up to date on breaking news coverage
BCH Price Prediction – February 11
Bitcoin Cash withdraw from yearly highs at $466 is necessary for the next rally as long as $400 support is not broken.
BCH/USD Market
Key Levels:
Resistance levels: $500, $520, $540
Support levels: $400, $380, $360
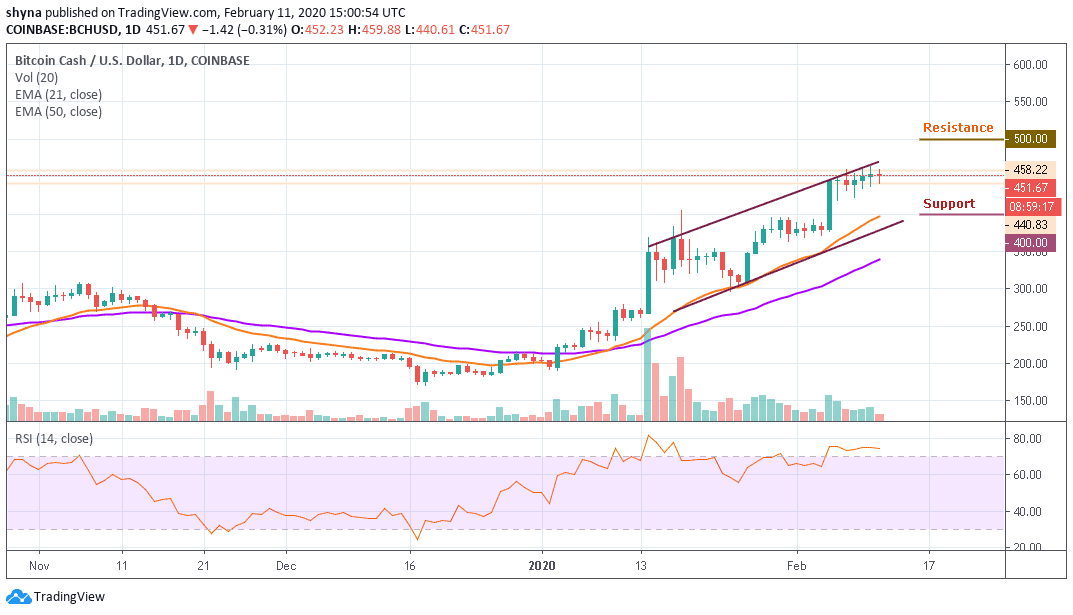
For the past few days, the BCH/USD price has been moving in sideways to support the market, against selling pressure. However, should Bitcoin Cash fall back to the old support and break-even, the bears might come back to dominate the market but at the time of writing, the bulls are still in charge. Therefore, traders can expect a bullish continuation before any reversal come into play.
Moreover, BCH/USD shifted its focus to $500 after clearing resistance at $450, although, the coin was extremely unstable for the past 6 days of trading. Nevertheless, the Bitcoin Cash touched $458 in the early hours of today before plunging back to $440. At the time of writing, Bitcoin Cash is following a bullish trend and trading at $451.67 above the 21 periods EMA within the ascending channel.
On the other hand, if the market drives below the $420 support, the BCH price slump to the initial support at $410, which may later bring the price back to its critical supports at $400, $380 and $360. Presently, the RSI (14) stays within the overbought zone, this could increase the buying pressure and it may likely break out of the ascending channel to reach the $480 resistance level. Meanwhile, a bullish continuation could hit the resistance levels at $500, $520 and $540.
Against Bitcoin, the daily chart reveals that the bears have started showing some commitment to BCH trading because of the recent rise of BTC. However, following the recent negative signs, the trend may continue to go down if the bears continue to pump more pressure into the market.
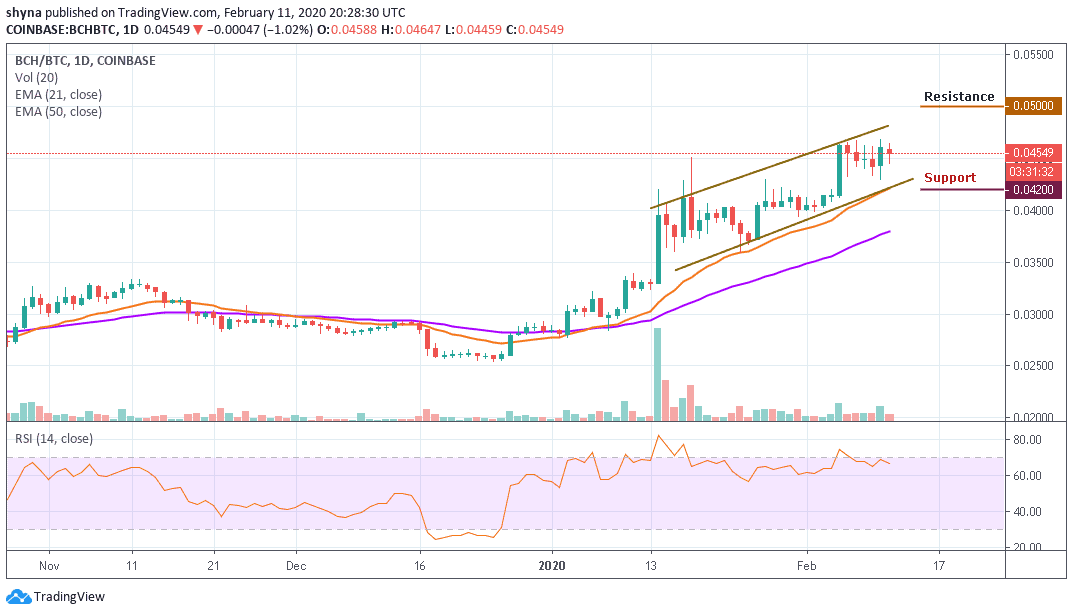
Moreover, as the RSI (14) signal line moves below 70-level, if the buyers can hold the support of 0.043 BTC, the market price may likely continue an upward movement, pushing further can take it to the resistance level of 0.050 BTC and 0.052 BTC but a retest could lower the price to 0.042 BTC and 0.040 BTC support levels.
Please note: Insidebitcoins.com is not a financial advisor. Do your research before investing your funds in any financial asset or presented product or event. We are not responsible for your investing results.
Join Our Telegram channel to stay up to date on breaking news coverage