Join Our Telegram channel to stay up to date on breaking news coverage
BCH Exhausts Energy – June 3
The market worth of BCH/USD has been on over a time struggling to push northward for increment but it has not able to swing past the resistance of $800. The market now exhausts energy to upswing as price trades around $712 at a rate of 2.11% appreciation as of writing.
Exhausts Energy: BCH Market
Key Levels:
Resistance levels: $800, $1,000, $1,200
Support levels: $500, $400, $300
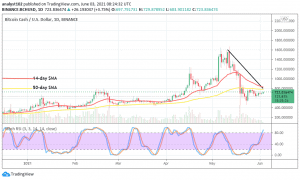
BCH/USD – Daily Chart
On the BCH/USD daily chart, it is depicted that the crypto has been continually featuring variant small candlesticks representing lower highs. The $800 value lines tightly between the SMAs. The bearish trend-line drew downward to markdown the immediate resistance level as mentioned earlier. The 50-day SMA indicator is underneath the 14-day SMA trend-line as they are also located closely. The Stochastic Oscillators are freshly into the overbought region with the two lines pointing toward the north. With the rate at which the crypto’s value is pushing, the required catalyst appears not building up strong for sustainable upkeep at a higher trading point it could eventually achieve.
How long will the BCH/USD’s $800 point remain the main resistant line as the crypto exhausts energy?
The market operations between Bitcoin Cash and the US Dollar have witnessed a struggling situation as the crypto exhausts energy to rebound northbound further under the market level of $800. An eventual close curving of the smaller SMA trend-line around the point mentioned earlier may in the long portend a continuation of an upward swing. However, it would be of less-active motion.
On the downside, it is believed that some degrees of barriers are being mounted around the key level of $800 as the Stochastic Oscillators have now placed in the overbought region. At this point, bears are enjoined to wait a while for an emergence of a bearish candlestick around the point being mentioned severally to confirm a return of a downward move. An interception of the bigger SMA from the top by the smaller SMA will add more to the downward signal strength.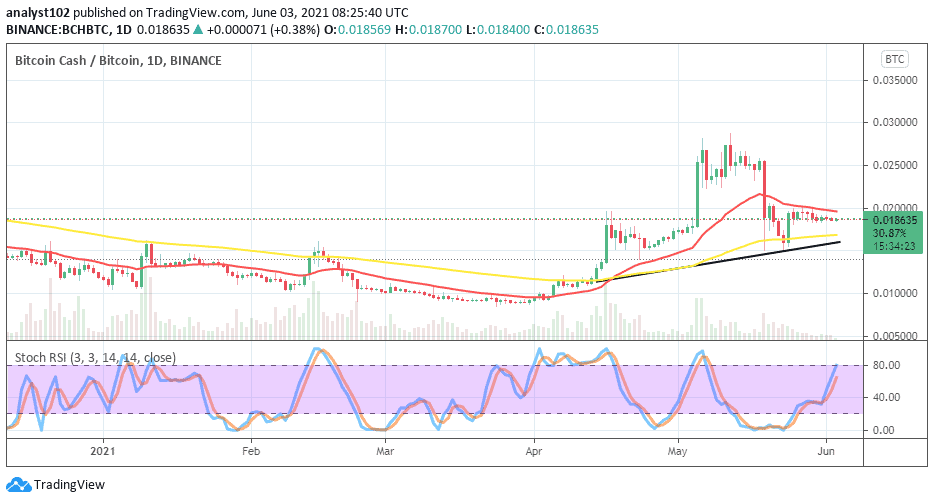
Looking to buy or trade Bitcoin Cash (BCH) now? Invest at eToro!
BCH/BTC Price Analysis
On the BCH/BTC daily price chart, the trend still gives that Bitcoin Cash as compared with Bitcoin has more upswing potentials than the counter crypto. After the emergence of a bullish candlestick on May 24, the base crypto has continually pushing to feature variant higher lows on the buy signal side of the bigger SMA. The bullish trend-line drew to play a supportive role to the 50-day SMA indicator as the 14-day SMA trend-line is located over them. The Stochastic Oscillators are with opened lines pointing toward the north near range 80. That shows that the base crypto still somewhat potentially has the advantage to push further against the counter instrument.
75% of retail investor accounts lose money when trading CFDs with this provider.
Join Our Telegram channel to stay up to date on breaking news coverage