Join Our Telegram channel to stay up to date on breaking news coverage
Bitcoin Cash Price Analysis – May 8
The price of Bitcoin Cash (BCH) has recovered from the daily low of $1323 level as the price remains within the short-term bullish trend.
BCH/USD Market
Key Levels:
Resistance levels: $1600, $1700, $1800
Support levels: $1100, $1000, $900
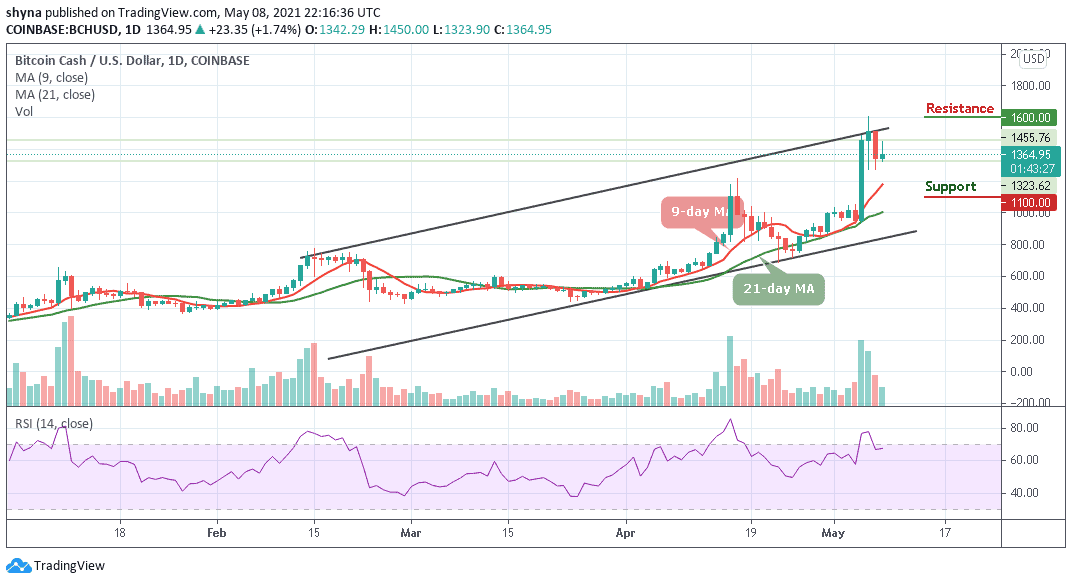
BCH/USD is recovering from the intraday low of $1323 after hitting the daily high at the $1450 resistance level. At the time of writing, BCH/USD is changing hands at $1364.95, having gained over 1.7% since the beginning of the European session and on a day-to-day basis. Despite the recovery, the ninth-largest digital asset with the current market value of $4.2 billion and $25.89 billion trading volume.
What is the Next Direction for Bitcoin Cash?
BCH/USD is currently moving towards the upper boundary of the channel at the price level of $1364. However, if the bulls maintain the upward trend, BCH/USD may likely cross above the channel which could push the coin to the resistance levels of $1600, $1700, and $1800, keeping the price above the 9-day and 21-day moving averages. In other words, any strong selling pressure may drag the price below $1200 if the bears step back into the market.
However, should in case Bitcoin Cash trades below the daily opening price of $1342, a bearish continuation could bring the price to the supports of $1100, $1000, and $900. Meanwhile, the Relative Strength Index (14) is seen moving below the 70-level, indicating a possible bullish movement may continue.
When compares with Bitcoin, the bears have shown little commitment to the current BCH market movement. However, following the recent negative sign, the current market movement may continue to follow the downtrend if the buyers failed to push the price above the upper boundary of the channel.
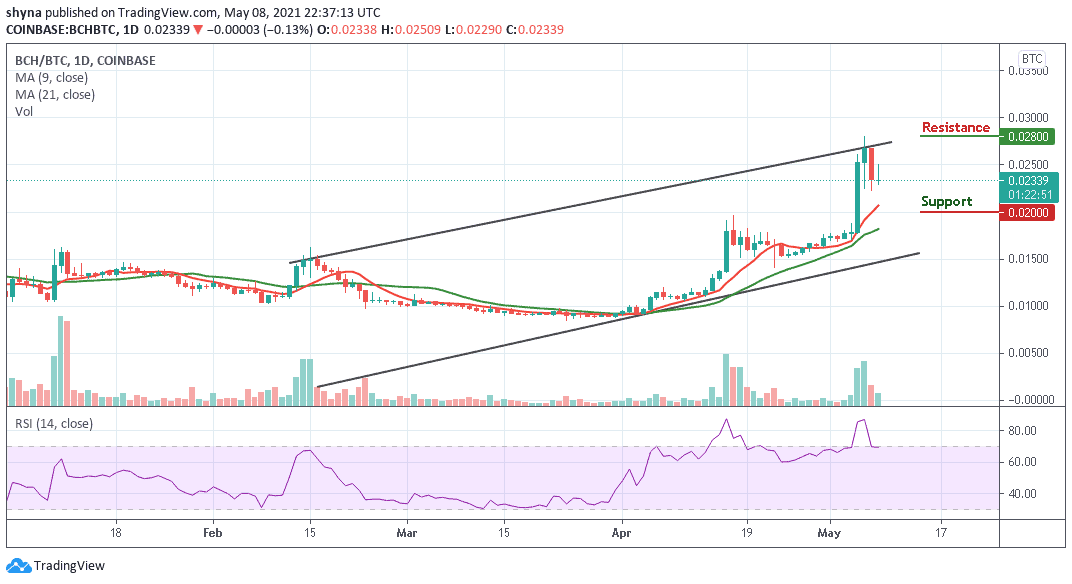
Moreover, as the technical indicator RSI (14) is moving in the same direction around 70-level, once it moves above this level, the market price could resume an upward trend to touch the resistance level of 0.028 BTC and 0.030 BTC but a retest could lower the price to the support levels of 0.020 BTC and 0.018 BTC respectively.
Looking to buy or trade Bitcoin Cash (BCH) now? Invest at eToro!
75% of retail investor accounts lose money when trading CFDs with this provider
Join Our Telegram channel to stay up to date on breaking news coverage