Join Our Telegram channel to stay up to date on breaking news coverage
The Amp price prediction may continue to show a bullish movement if the market rises above the $0.0060 resistance level.
Amp Prediction Statistics Data:
- Amp price now – $0.0049
- Amp market cap – $208.2 million
- Amp circulating supply – 42.2 billion
- Amp total supply – 99.2 billion
- Amp Coinmarketcap ranking – #127
AMP/USD Market
Key Levels:
Resistance levels: $0.0065, $0.0070, $0.0075
Support levels: $0.0035, $0.0030, $0.0025
Your capital is at risk
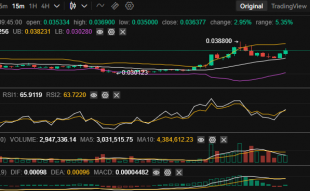
AMP/USD is showing positive movement at the time of writing as the market crosses above the 9-day and 21-day moving averages. Apart from this, the Amp price still has to cross above the upper boundary of the channel and traders can expect the price to continue to rise as soon as this is done.
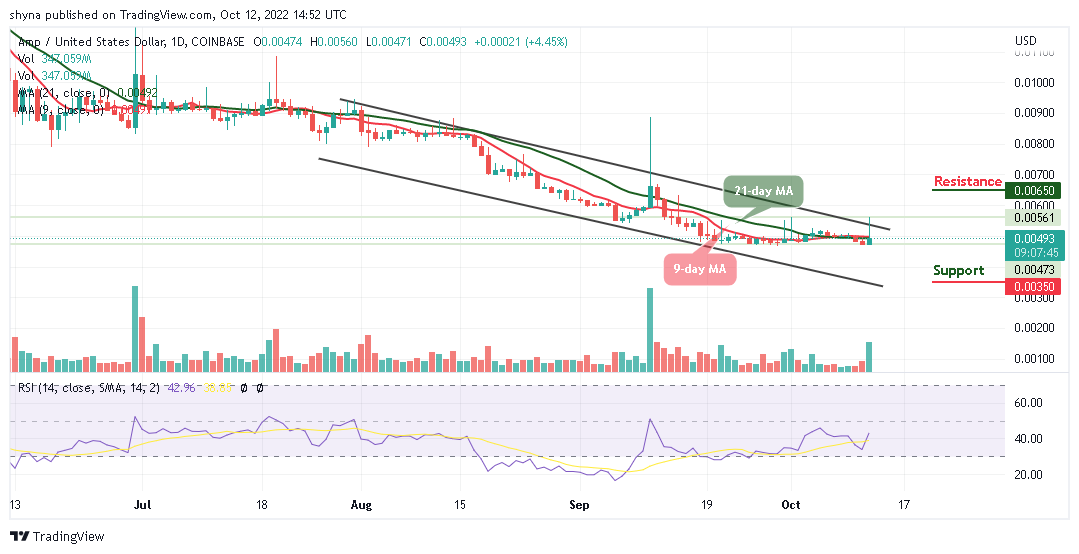
Amp Price Prediction: Amp Price Will Shoot to the North
The daily chart shows that the Amp price is attempting to create a new positive trend, and traders may expect a bullish continuation above the upper boundary of the channel which could revisit the resistance level of $0.0056. Similarly, the technical indicator reveals Relative Strength Index (14) crosses above the 40-level, any additional bullish movement may locate the potential resistance levels at $0.0065, $0.0070, and $0.0075 in the long term.
Furthermore, if the Amp price maintains the rising channel pattern, traders may witness additional bullish trends in the coming trading sessions. Meanwhile, a bearish breakdown may likely play out for this market if AMP/USD withdraws back below the 9-day and 21-day moving averages, and this could roll the coin back to the support levels at $0.0035, $0.0030, and $0.0025.
Against Bitcoin, the Amp price keeps moving sideways as the coin trades below the 9-day and 21-day moving averages. More so, if the coin touches the nearest resistance level of 30 SAT, it may continue to range-bounds in as much as the technical indicator Relative Strength Index (14) moves in the same direction.
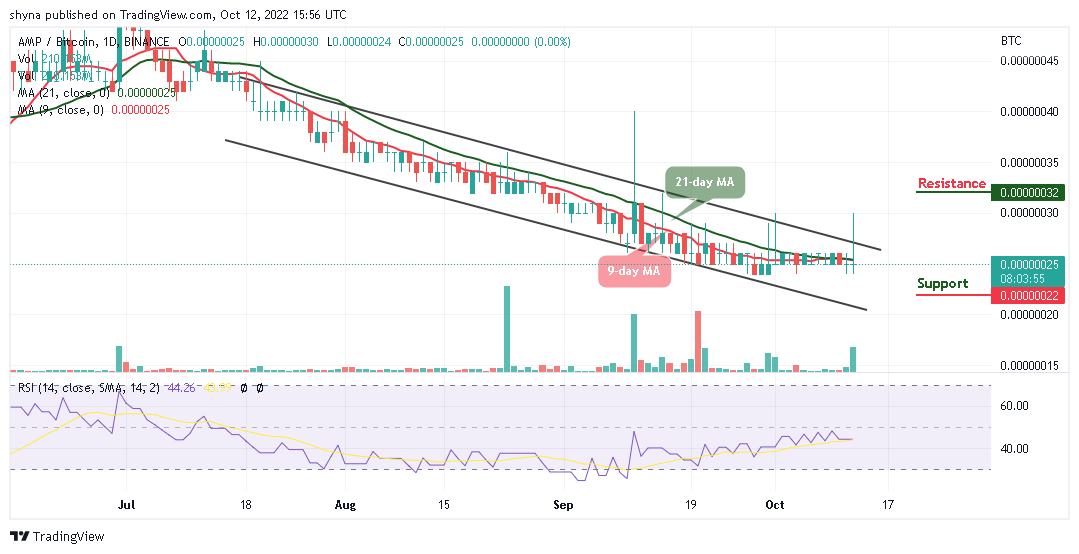
However, if AMP/BTC falls below the 9-day and 21-day moving averages, it may bring the coin to the nearest support at 24 SAT, and any further bearish movement could lower the price to the support level of 22 SAT and below. Nevertheless, if the coin begins to follow a bullish movement by crossing above the upper boundary of the channel, traders could see a bull run to the resistance level of 32 SAT and above.
Join Our Telegram channel to stay up to date on breaking news coverage