Join Our Telegram channel to stay up to date on breaking news coverage
TRXUSD Price Analysis – August 12
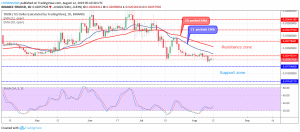
Tronix price broke down the support zone of $0.021, currently carrying out price retracement, before the continuation of a bearish trend which may test the demand zone of $0.017
TRXUSD Markets
Key Levels:
Resistance Zones: $0.021, $0.027, $0.032
Support Zones: $0.017, $0.011, 0.006
TRX/USD Long-term Trend: Bearish
Tronix is bearish in the long-term outlook. The coin reached the resistance zone of $0.036 on July 10 and the bearish pressure force the price to drop to the support zone of $0.021. The support zone was defended by the Bulls, the price pulled back for four days to retest the supply zone of $0.027. The coin could not break up the confluence at the zone. The dynamic resistance level prevented a further increase in price. The Tronix price fell back to the previous support zone of $0.021on July 27. The coin consolidated for many days at the just mentioned zone. On August 09, the Bears broke down the level and the price moved towards the $0.017.

TRXUSD is trading below the 21 periods EMA and 50 periods EMA in which the former is below the later which indicates bearish pressure in the Tronix market. The Stochastic Oscillator period 14 is above 20 levels with the signal lines bending up which indicate a buy signal which may be a price retracement. Tronix price broke down the support zone of $0.021, currently carrying out price retracement, before the continuation of a bearish trend which may test the demand zone of $0.017
TRX/USD Short-term Trend: Bearish
ETHUSD price is bearish on the medium-term outlook. After many days of consolidation at the resistance zone of $0.021, the Tronix price broke out towards the south on August 09 and the price decreased further towards $0.017. The demand zone of $0.017 is yet to be reached before the price turned upside to retest the broken level.
Tronix is trading below the 21 periods EMA and 50 periods EMA. The Stochastic Oscillator period 14 is around 80 levels and the signal lines is attempting to bend down which indicates sell signal.
Please note: insidebitcoins.com is not a financial advisor. Do your research before investing your funds in any financial asset or presented product or event. We are not responsible for your investing results
Join Our Telegram channel to stay up to date on breaking news coverage