Join Our Telegram channel to stay up to date on breaking news coverage
XRP Price Prediction – March 14
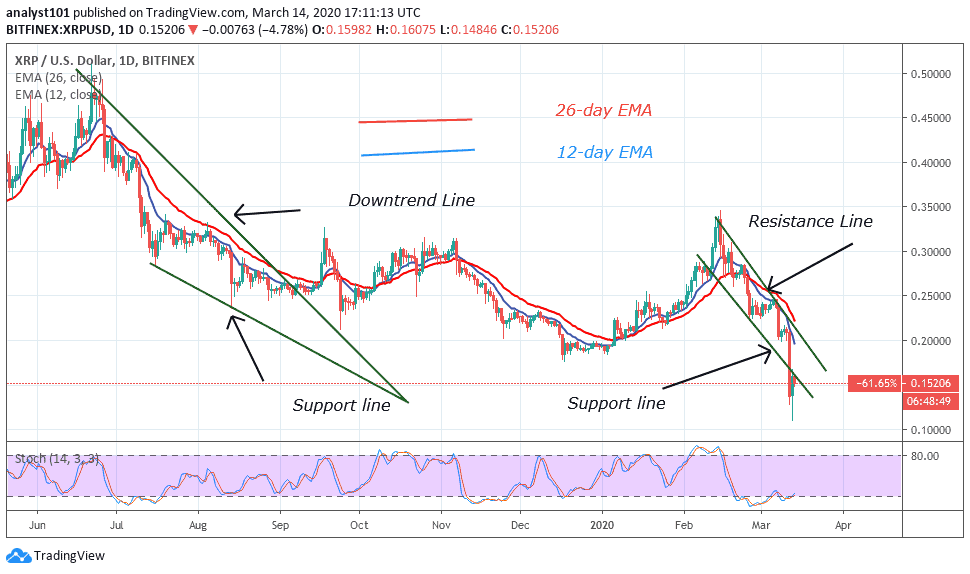
Ripple (XRP) has been down by more than 4.8% in the last 24 hours; the value has gone below $0.16.
XRP/USD Market
Key Levels:
Resistance levels: $0.20, $0.22, $0.24
Support levels: $0.10, $0.08, $0.06
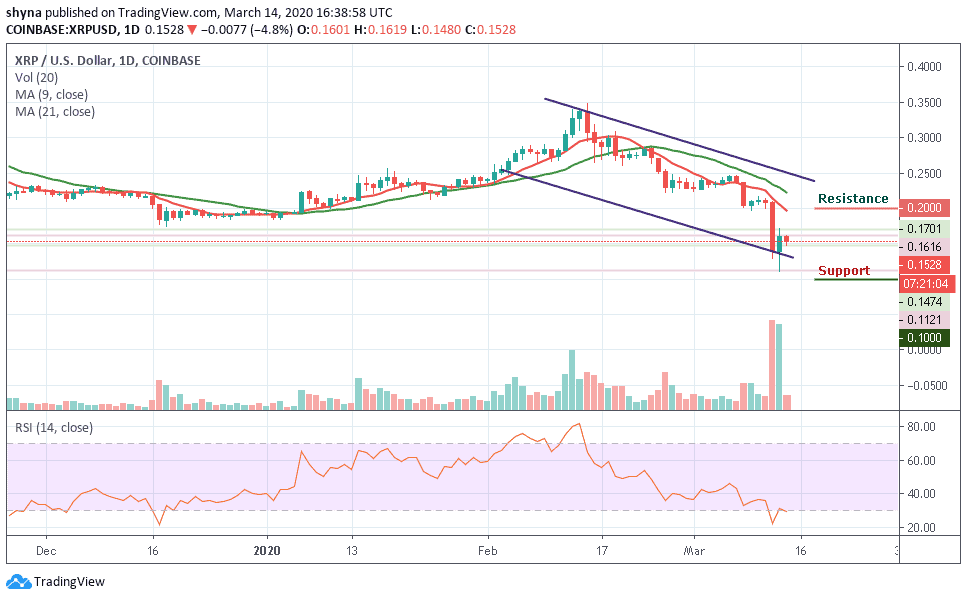
XRP/USD is facing a downward movement at the moment and its current dilapidated condition can be blamed upon the overall gloomy market. Both the 9-day and 21-day moving averages are going above the current price that hints at a delay for bringing a turnaround. Meanwhile, a break in the channel may likely give the market enough strength to dig dip, but the rise might lead the market to a bullish scenario.
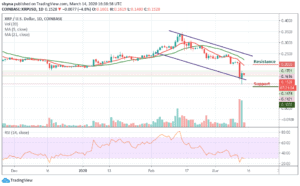
However, XRP/USD is moving within a descending channel boundary on the daily chart. Technically, the channel formation is a bearish flag pattern that mostly followed a break-down in price. Following the past one day of price actions, XRP is consolidating at the lower boundary of the channel. Currently, the price is bearish but a bounce back to $0.20, $0.22 and $0.24 resistance levels may once again give strength to the $0.15 support.
More so, if this support gets weak, a price break-down may occur as the bears may find new monthly lows at $0.10, $0.08 and $0.06 levels. From a long-term perspective, Ripple’s XRP is still in a dominant bearish bias. The RSI (14) is showing sideways movement as it is above the oversold zone. If the price oscillates downward, XRP/USD may fall back to the $0.11 support level.
Against Bitcoin, the pair is consolidating within the channel and moving above the 9-day and 21-day moving averages. Meanwhile, the sellers are trying to push the price below the moving average and the bearish continuation may bring it to the support levels of 2400 SAT and 2200 SAT respectively.
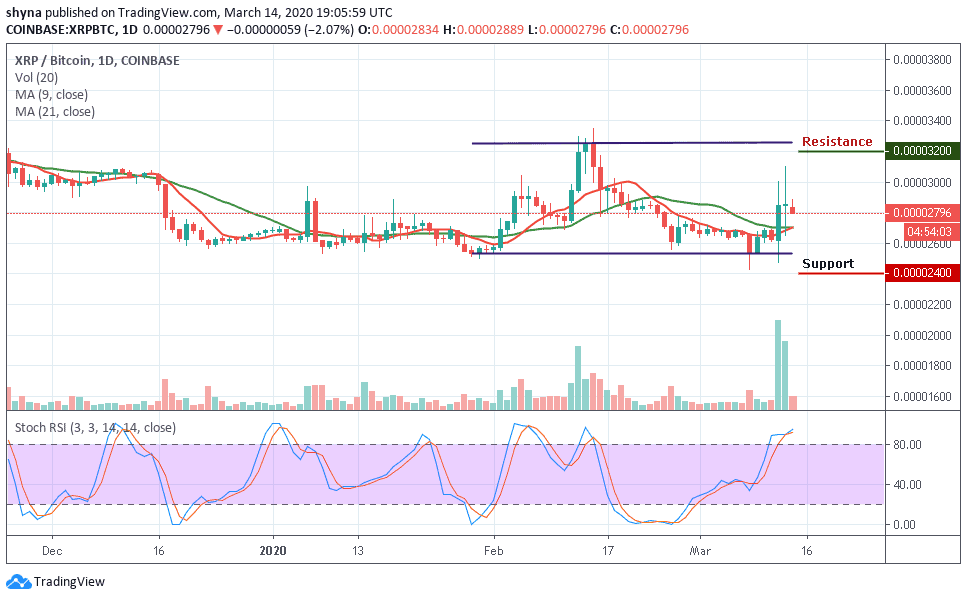
Looking at the daily chart, if the bulls can regroup and push the market towards the north, a possible rise could take the market to the resistance levels of 3200 SAT and 3400 SAT. According to the stochastic RSI, the signal lines are moving within the overbought zone, which suggests that more bearish movement may soon come to play.
Please note: Insidebitcoins.com is not a financial advisor. Do your research before investing your funds in any financial asset or presented product or event. We are not responsible for your investing results.
Join Our Telegram channel to stay up to date on breaking news coverage