Join Our Telegram channel to stay up to date on breaking news coverage
XRP Price Prediction – November 13
Ripple has traced an impulse pattern over the last 4 hours as the coin recently formed a bullish trend line though it seems far away from a $0.28 price mark.
XRP/USD Market
Key Levels:
Resistance levels: $0.310, $0.320, $0.330
Support levels: $0.240, $0.230, $0.220
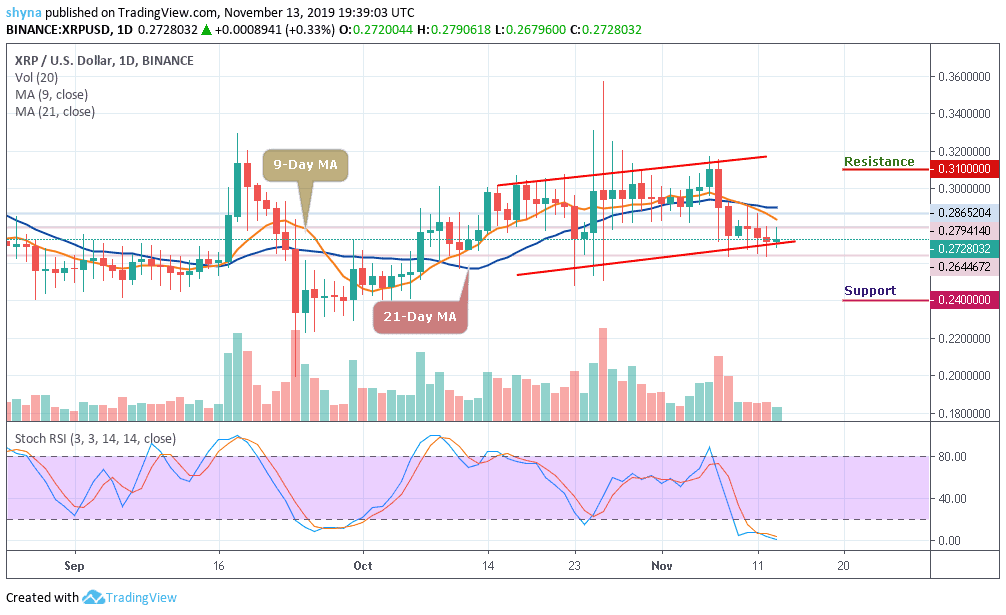
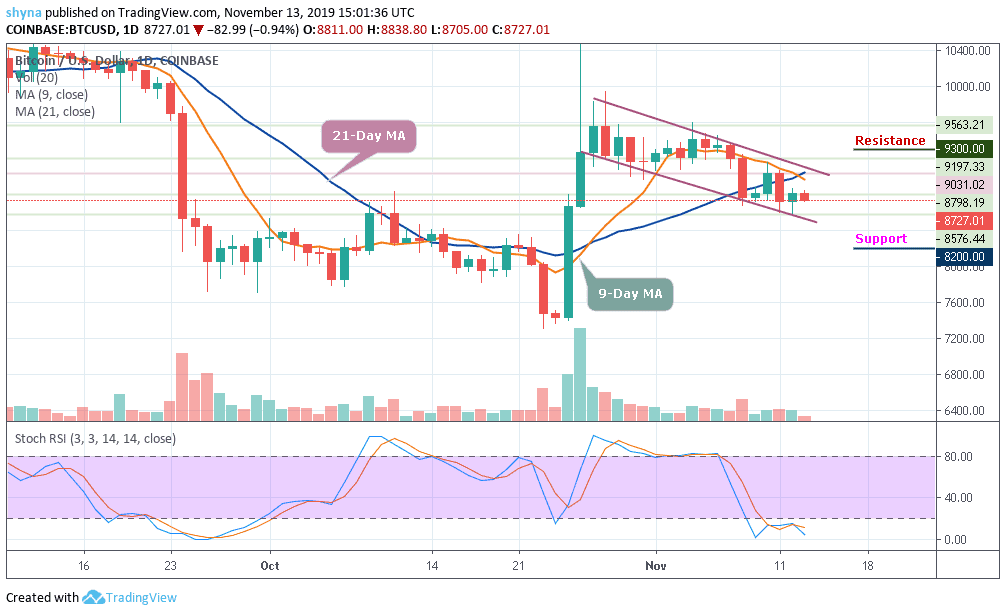
Ripple is facing hardships these days to pace up its price as it is already below major support levels. Even though the chart shows volatility, XRP/USD has crossed $0.31 price level for only once, in the last one month. A few hours ago, Ripple closed a bearish candle at $0.2717, and it tumbled further to $0.2712. From here, it struck a rise of 0.62% reaching $0.2729. The XRP coin again took a plunge followed by a rebound forming an impulse pattern.
Looking at the daily chart, $0.27 remains now the key support for XRP/USD as the price moves below the 9-day and 21-day MA. As long as it remains intact, the coin has a chance to resume an upward recovery; though, in the short-run, the upside momentum may be capped by $0.280. Meanwhile, on the downside, the coin has been ranging between the support levels of $0.2712 to $0.2797.
Moreover, for the upside to gain traction, the coin needs to regain ground above $0.287, while $0.310, $0.320 and $0.330 resistance levels are still the ultimate targets for the bulls. For now, the key support level to watch for lies at $0.24 and $0.23. A further drop may slip the price to $0.22 and below. More so, the stochastic RSI is within the oversold territory, suggesting that the bears may keep dominating the market for now.
Against Bitcoin, the situation is becoming bleak as the market is trading in a symmetrical triangle which may likely validate the resistance level of 3199 SAT if a break out comes into play. Meanwhile, should the Ripple price failed to break above this resistance, it could cause a drop down to 3000 SAT. From upside, the nearest levels of resistance lie at 3250 SAT.
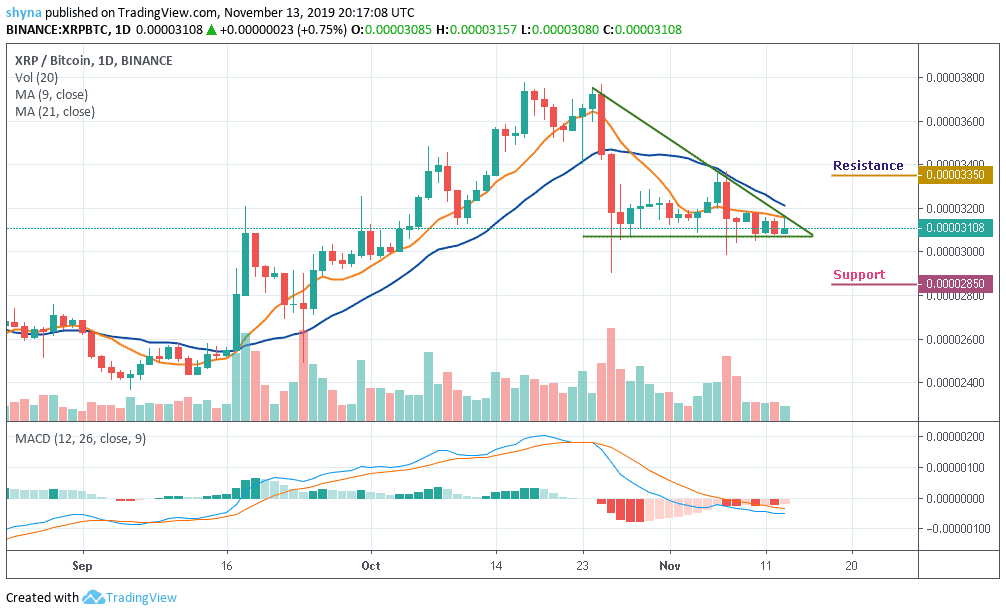
Moreover, if the bulls can break above 3250 SAT, further resistance is found at 3350 SAT and 3450 SAT but if the sellers bring the price beneath the 3050 SAT, the next level of support is located at 3000 SAT and more support is found at 2850 SAT and 2750 SAT. The trading volume has also significantly decreased while the MACD signal lines have crossed to the negative side which may bring the bears back in control.
Please note: Insidebitcoins.com is not a financial advisor. Do your research before investing your funds in any financial asset or presented product or event. We are not responsible for your investing results.
Join Our Telegram channel to stay up to date on breaking news coverage