Join Our Telegram channel to stay up to date on breaking news coverage
ETH Price Prediction – March 31
Ethereum price is showing some positive signs above $132 against USD; the price may likely start a fresh increase above $135.
ETH/USD Market
Key Levels:
Resistance levels: $160, $170, $180
Support levels: $100, $90, $80
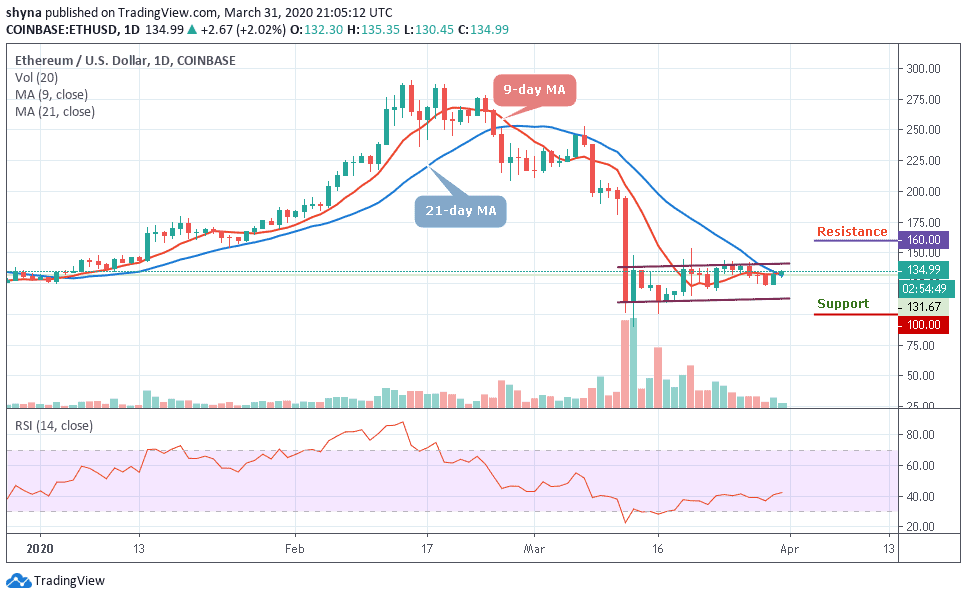
ETH/USD has jumped from $130.05 to touch the intraday high at $136.55 in a matter of hours. The crypto has retreated to $130 as at the time of writing but the pair still retains the bullish momentum. In the short term, ETH/USD has gained more than 2.02% since the beginning of the trading day.
However, due to a strong upside movement of the coin, ETH/USD broke free from the recent sideways movement and it is currently trading above the 9-day and 21-day moving averages. Looking at the daily chart, the $120 remains to be a key support zone and if it is broken, the sell-off may be extended towards $110 support level.
Currently, the price of the coin is changing hands at $134.99 level and the bulls are making effort to push it above the 9-day and 21-day moving averages. In other words, any reversal to the south may likely welcome the resumption of the bears back into the market and the price could meet the critical supports at $100, $90 and $80 levels.
More so, the RSI (14) moves to cross above the 40-level, which indicates the continuation of the bullish trends and further resistance could be found at $160, $170 and $180 levels.
Against Bitcoin, Ethereum (ETH) is currently changing hands at 0.0208 BTC after witnessing some heavy bearish moment in the last few days. Looking at the daily chart, the current trend of the coin is still the same but the bulls tried to push the coin towards the 9-day MA within the descending channel after which it started falling again.
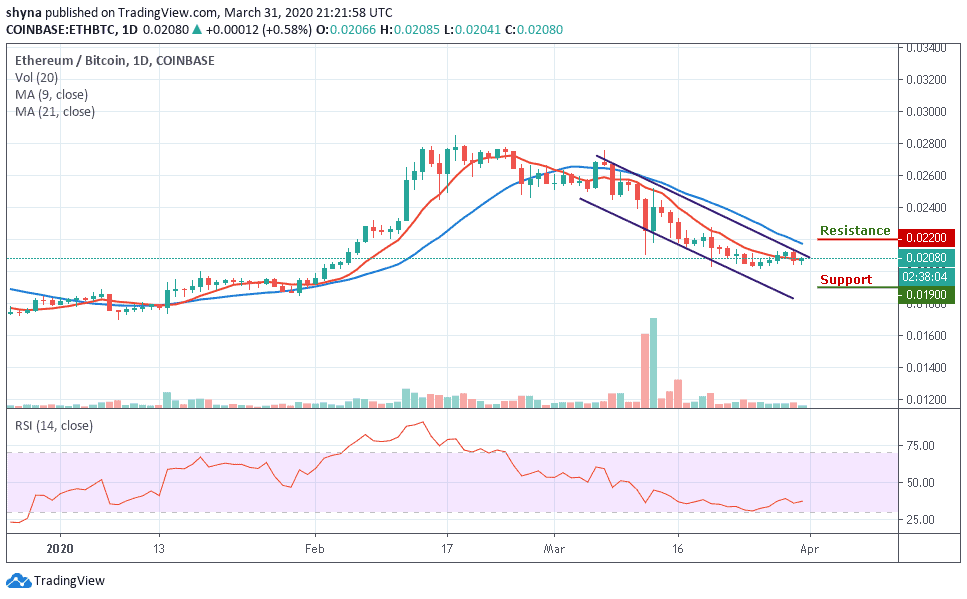
More so, if the bulls manage to power the market, it may soon find the resistance level at 0.0220 BTC and above. Similarly, the daily chart reveals that ETH/BTC is currently consolidating within the market and may start moving in sideways on the medium-term outlook. We can expect a surge in volatility to occur as the technical indicator RSI (14) moves around 37-level.
Please note: Insidebitcoins.com is not a financial advisor. Do your research before investing your funds in any financial asset or presented product or event. We are not responsible for your investing results.
Join Our Telegram channel to stay up to date on breaking news coverage