Join Our Telegram channel to stay up to date on breaking news coverage
ETH Price Prediction – January 28
The price to buy Ethereum (ETH) started today on a positive note and the coin has traced a bullish trend line since the beginning of today.
ETH/USD Market
Key Levels:
Resistance levels: $200, $205, $210
Support levels: $154, $149, $144
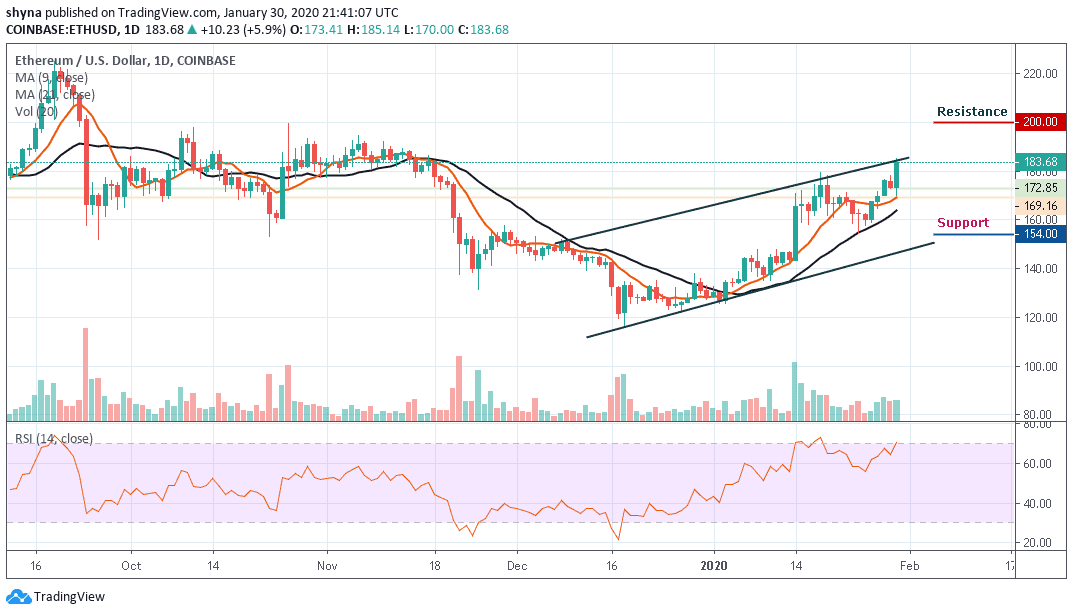
A few days ago, ETH/USD price saw a notable price decline below the 9-day moving average, followed by a rebound. The coin continues the rebound today and since the opening of today’s trading, Ethereum (ETH) price has not broken above the upper boundary of the channel except for the recent correction. The coin has climbed above $183.68 from its today’s opening price of $172.85.
However, ETH/USD is currently changing hands at $183.68 level, the crypto is now trading above the 9-day and 21-day moving averages. If there is a bullish break above the resistance level at $185, Ethereum’s price could continue to accelerate in the short term (find out how to buy Ethereum with PayPal). The next stop for the bulls could be $190, followed by $200, $205 and $210 resistance levels.
Conversely, if there is no increase above $185, the price could fall below the support level of $180. If there is a downside break, there could be sharp losses below the $175 and $170 levels. In the mentioned case, the price may even slide below the $154, $149 and $144 support levels. The RSI (14) indicator for ETH/USD is slowly moving into the overbought territory, with a few positive signs.
Against Bitcoin, Ethereum (ETH) is currently changing hands at 1935 SAT after witnessing some slightly bearish moment in the last few days. However, looking at the daily chart, the current trend of the coin is perpetually looking bullish in the short-term, moving around the 9-day and 21-day moving averages within the channel.
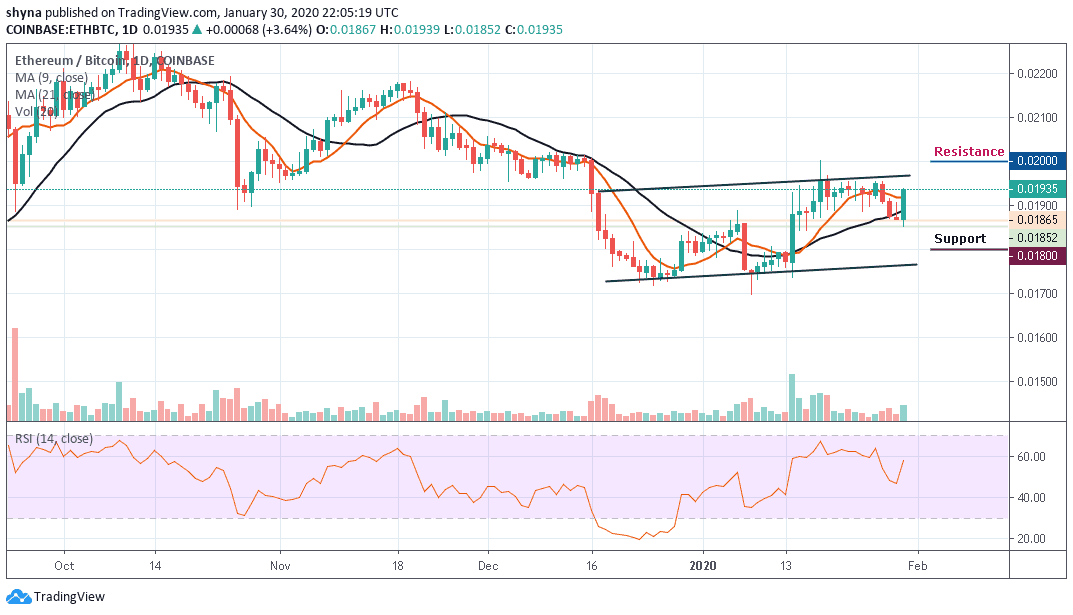
Meanwhile, as the price moves within the channel, the resistance levels to look for are 2000 SAT and 2050 SAT while the closest support levels to keep an eye on are 1800 SAT and critically 1750 SAT. The RSI (14) moves above level 55, which may likely give more bullish signals in the nearest term.
Please note: Insidebitcoins.com is not a financial advisor. Do your research before investing your funds in any financial asset or presented product or event. We are not responsible for your investing results.
Join Our Telegram channel to stay up to date on breaking news coverage