Join Our Telegram channel to stay up to date on breaking news coverage
Ethereum (ETH) Price Prediction – December 21
Ethereum is trading at $608 at the time of writing. The biggest altcoin has risen to $670 after breaking the $ 620 overhead resistance. There is a bearish reaction as the coin faces another rejection. On the ETH/BTC chart, the crypto is still in a downward move despite the correction in November.
ETH/USD Market
Key Levels:
Resistance Levels: $700, $720, $740
Support Levels: $280, $260, $240

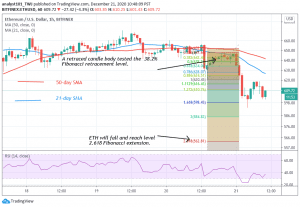
ETH/USD has been in a bull market since September and has reached a high of $670. Presently, the crypto is falling because of rejection from the recent high. The rejection was caused by a long wick on a daily candlestick which indicates strong selling pressure at a higher price level. Ethereum has already fallen to $608, if the support fails to hold, the downtrend will extend to the low of either $580 or $540.
On the upside, if the bulls have broken the minor resistance at $670, Ether will attain a new high of $838. The Fibonacci tool has indicated a downward movement of the coin. On December 20, a retraced candle body tested the 38.2% Fibonacci retracement level. This indicates that the coin will fall and reach level 2. 618 Fibonacci extensions. That is Ethereum will reach a low of $562.81.
Ethereum Indicator Analysis
Ethereum has fallen to level 38 of the Relative Strength Index period 14. It indicates that the coin is in a downtrend zone and below the centerline 50. The price bars are below the SMAs which suggest a downward movement of the coin.
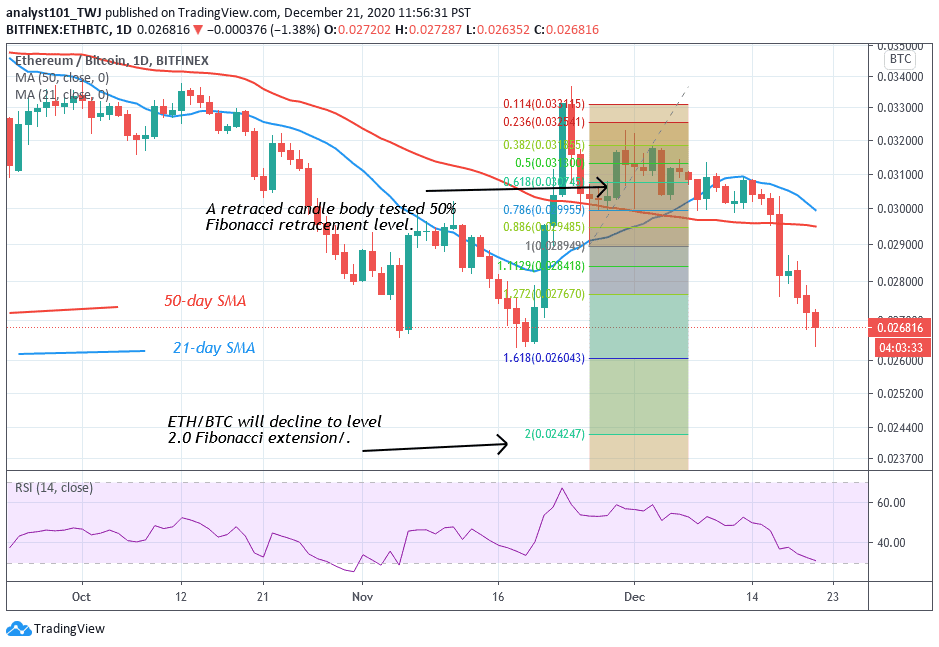
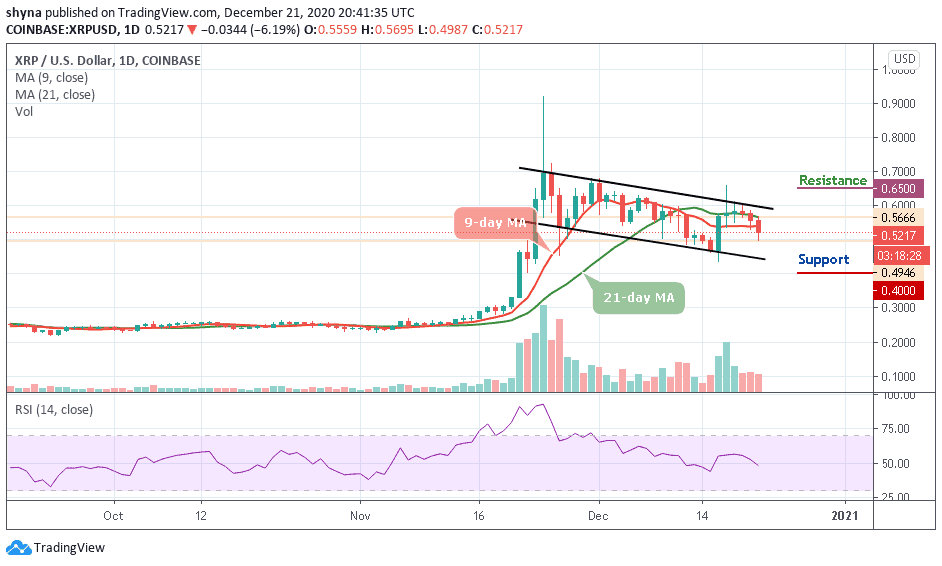
Nevertheless, on the ETH/BTC, the coin is in a downward move. In November the price corrected upward, On November 25 downtrend; the red retraced candle body tested the 50% Fibonacci retracement level. This retracement suggests that the market will fall to the low of Ƀ0.024247. The crypto has fallen to level 30 of the Relative Strength Index period 14. It indicates that the coin is approaching the oversold region of the market.
Join Our Telegram channel to stay up to date on breaking news coverage