Join Our Telegram channel to stay up to date on breaking news coverage
Ethereum Price Prediction – May 26
ETH/USD bulls failed to climb above the daily high of $2889 level as the Ethereum price touched the daily low at $2639.
ETH/USD Market
Key Levels:
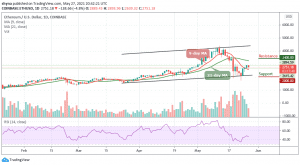
Resistance levels: $3400, $3600, $3800
Support levels: $200, $1800, $1600
According to the daily chart, ETH/USD is hovering at $2751.18 so it may take a few more days for it to catch up above the $3000 resistance level.
However, the Ethereum price has not seen any major pullbacks yet and may use the 9-day MA for support if it happens. In addition, the most important signal for Ethereum is the break of $2900, which represented a major resistance level. Therefore, should in the case of bulls staying above this level, they may absolutely confirm a monthly uptrend.
Ethereum Price Prediction: Will ETH Break $3000 or Reverse?
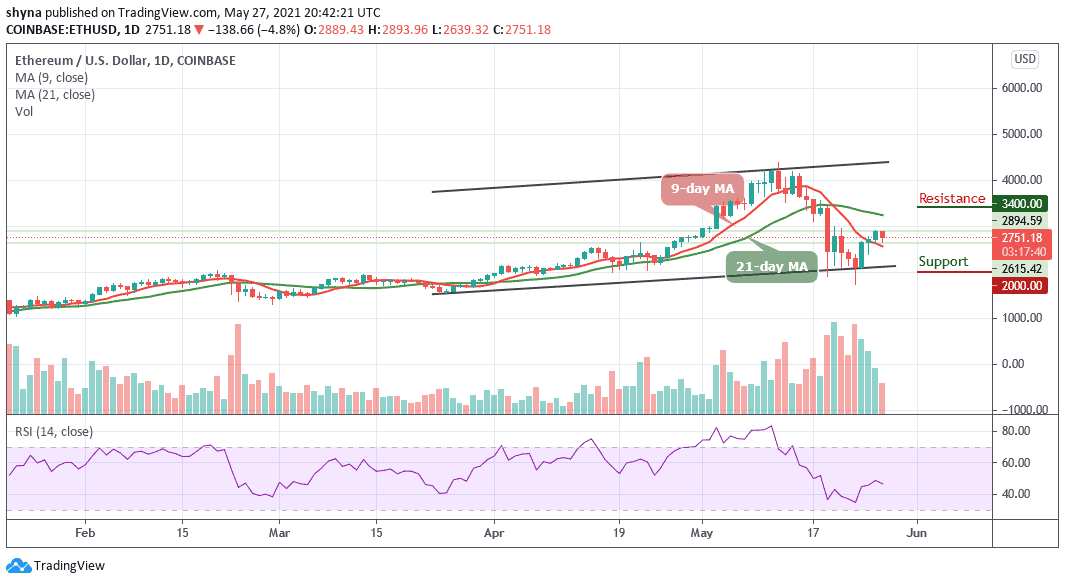
The Ethereum pair may succumb to selling pressure if the price drops below the 9-day moving average at $2500 support.
Meanwhile, the Ethereum price hasn’t changed much during the past few days despite the massive flash crash down to $1728 suffered on May 23. The digital asset is currently fighting to stay above $2700 but might not face a lot of resistance until it gets to the $2900 level.
Moreover, the technical indicator Relative Strength Index (14) is seen moving below 48-level, therefore, if the signal line drops below this level, the market price may likely resume the downtrend to hit the supports at $2000, $1800, and $1600, but if it breaks above the 21-day MA upward, the potential resistance at $3400, $3600, and $3800 may be visited.
Against the BTC, the Ethereum price is clearly bearish. As the price falls, sellers are posing an additional threat for buyers which could slump below the 21-day moving average where the nearest target is located. However, an eventual break below this barrier may cause the coin to collapse.
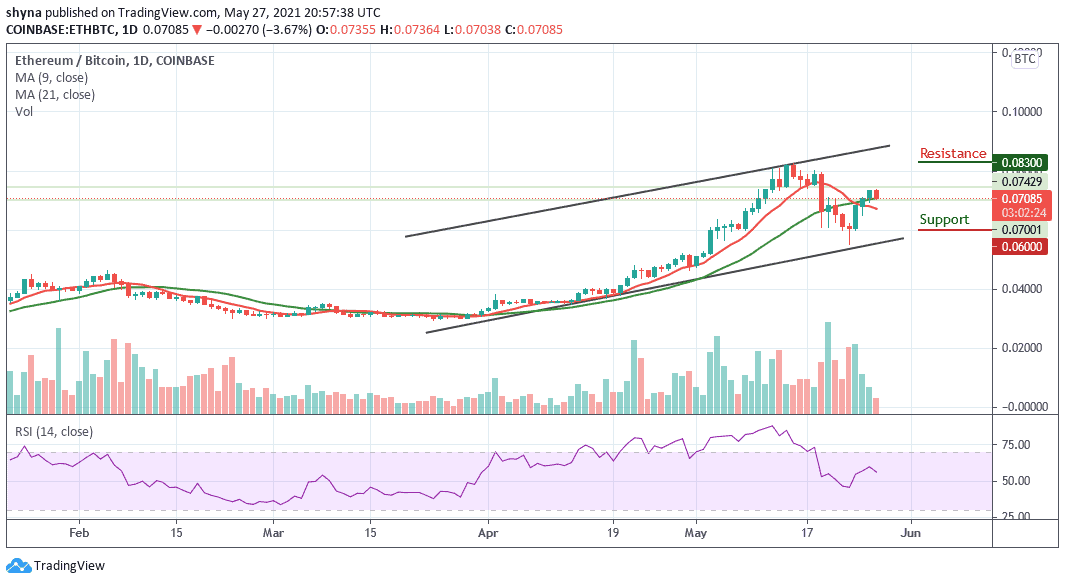
However, a continuation of the downtrend could hit the main support at 0.065 BTC before falling to 0.060 BTC and below as the Relative Strength Index (14) is seen moving below 60-level. Meanwhile, if the price faces the upside, the buyers may resume back and push the market to the potential resistance at 0.083 BTC and above.
Looking to buy or trade Ethereum (ETH) now? Invest at eToro!
75% of retail investor accounts lose money when trading CFDs with this provider
Join Our Telegram channel to stay up to date on breaking news coverage