
Join Our Telegram channel to stay up to date on breaking news coverage
After the bearish trend from the 16th of August to the 7th of September, AMP/USD buyers attempted to salvage the market on the 11th of September. Although the price reached the $0.0080 price level, the bulls almost lose out totally for the day. They repeated this on the following day, but this time, sellers became stronger and they took the market. And from then, the consolidation period ensued.
AMP Market Price Statistic:
- AMP/USD price now: $0.0050
- AMP/USD market cap: $211,083,299
- AMP/USD circulating supply: 42.23Billion
- AMP/USD total supply: 1,000,000,000
- AMP/USD coin market ranking: #125
Key Levels
- Resistance: $ 0.0055, $0.0060, $0.0065
- Support: $0.0040, $0.0035, $0.00300
Your capital is at risk
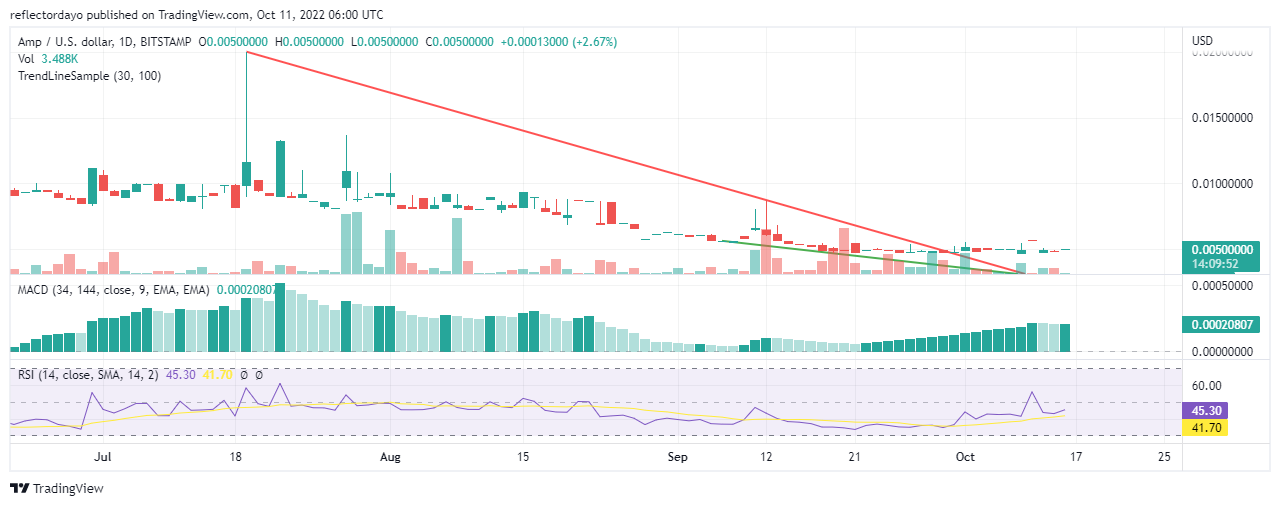
Amp Market Price Analysis: The Indicators’ Point of View
From the 22nd of September till date, apart from some bumps in the price action, the market was flat. Most of the candles that represent each day’s trading sessions were four-price dojis. This portrays the low amount of interest in the market as we can’t see much pull and push. When we look at the RSI indicator from a bird’s eye view, we can see a slight shift to the upside even though the price chart did not have much encouraging performance.
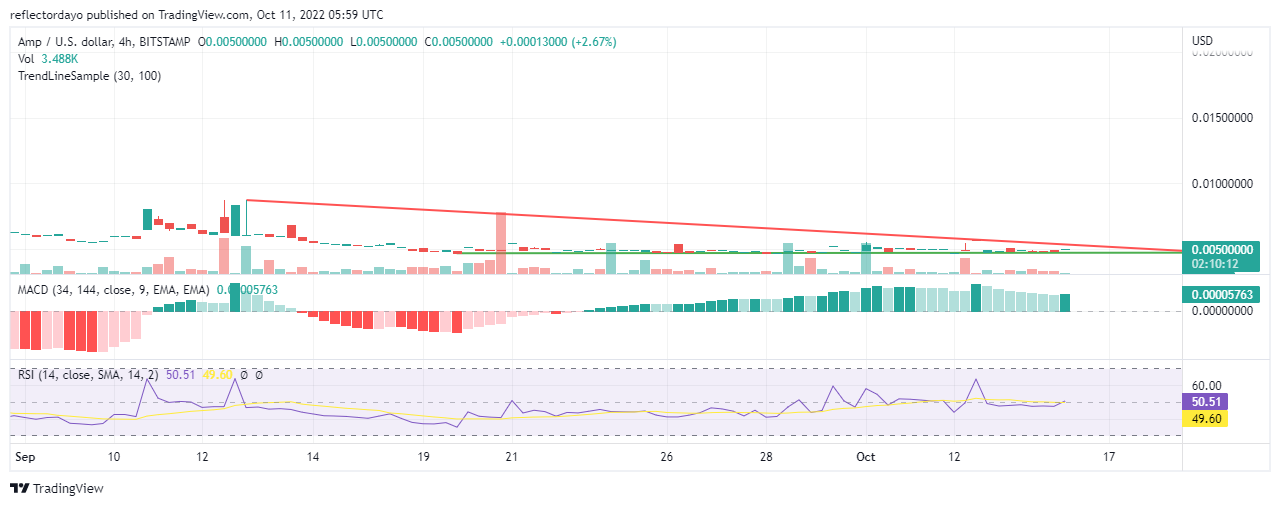
AMP/USD 4-Hour Chart Outlook
The trend lines from this outlook are converging at the centre (forming a symmetrical triangle) as the market continues to move sideways. This means that there is about to be a decisive movement of the market trend in either of the two ways. From the market performance since the middle of August, bullish moves have been responsive to bearish moves and vice versa. When there is no push or pull from both ends, the market continued on a 4-price doji candlestick pattern. Because of this, the market may continue to range sideways.
Join Our Telegram channel to stay up to date on breaking news coverage