Join Our Telegram channel to stay up to date on breaking news coverage
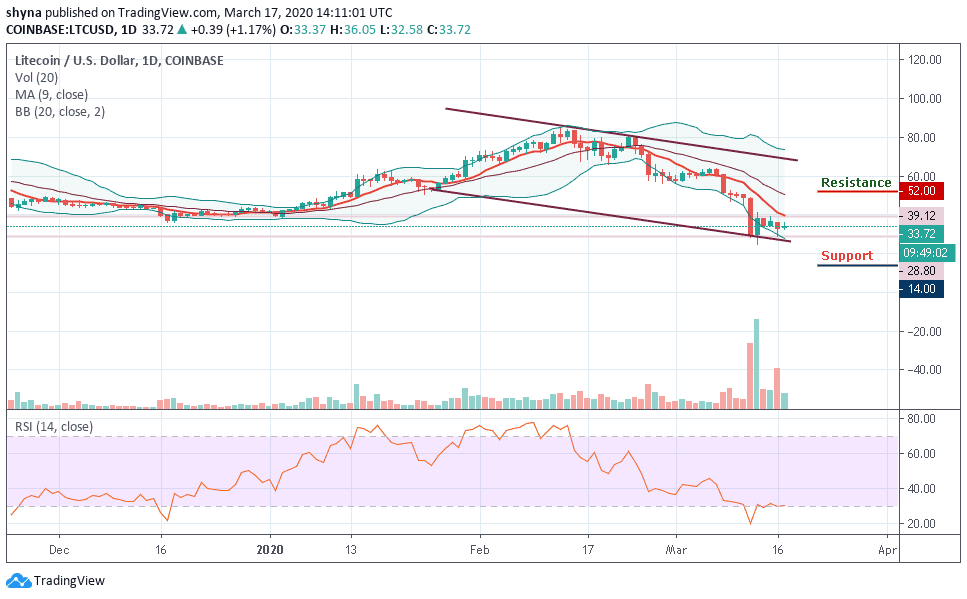
Bitcoin (BTC) Price Prediction – March 17
The Bitcoin price finds support at $5,000 and it may need to clear the resistance at $6,000.
BTC/USD Long-term Trend: Bearish (Daily Chart)
Key levels:
Resistance Levels: $7,000, $7,200, $7,400
Support Levels: $3,800, $3,600, $3,400
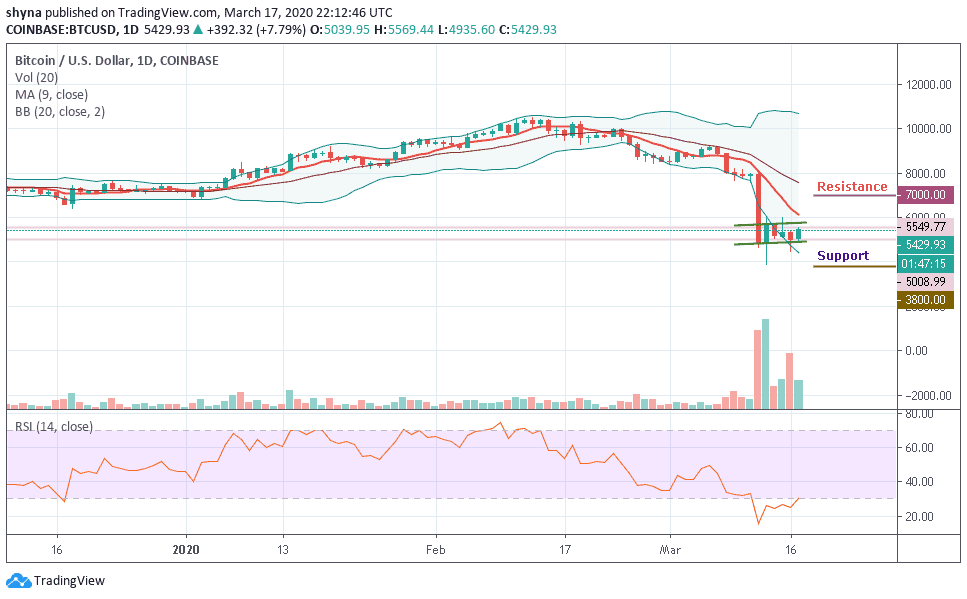
BTC/USD has recovered to over $5,400, having gained nearly 7.79% since the start of the day. In addition to the upside move, the coin is still moving within a short-term bearish trend amid low volatility. Bitcoin (BTC), at the time of penning down this piece, was trading at $5,429.93, after having a price accumulation since the start of the trading day today.
Nonetheless, the Bitcoin price has already experienced a clumsy fall below $5,000 yesterday for the second time in a period of 7 days. Undoubtedly, the coin has recovered from the intraday fall as it rises above $5,000 again, and with this, the dramatic support for the BTC lies at $4,000. More support levels at $3,800, $3,600 and $3,400 may be visited.
However, short term analysis shows that Bitcoin price has a bullish bias because the RSI (14) is about to recover from the oversold zone. There is a possibility of a ranging trend taking over if an attempt to rise to $6,000 falls under $5,500. On the upside, a breakout from the channel could result in gains towards $6,000 and this may depend on the magnitude of the technical breakout, positive sentimental change, and increased volume.
Meanwhile, the resistance levels to watch for are $7,000, $7,200 and $7,400 respectively.
BTC/USD Medium – Term Trend: Ranging (4H Chart)
The 4-hour chart reveals that BTC/USD is trading within the range of $4,546 to $5,860. The Bitcoin price hovers around $5,466 and may take time to persistently trade above $6,000. The upward movement may likely reach the nearest resistance at $6,400 and $6,600 if the bulls put more effort.
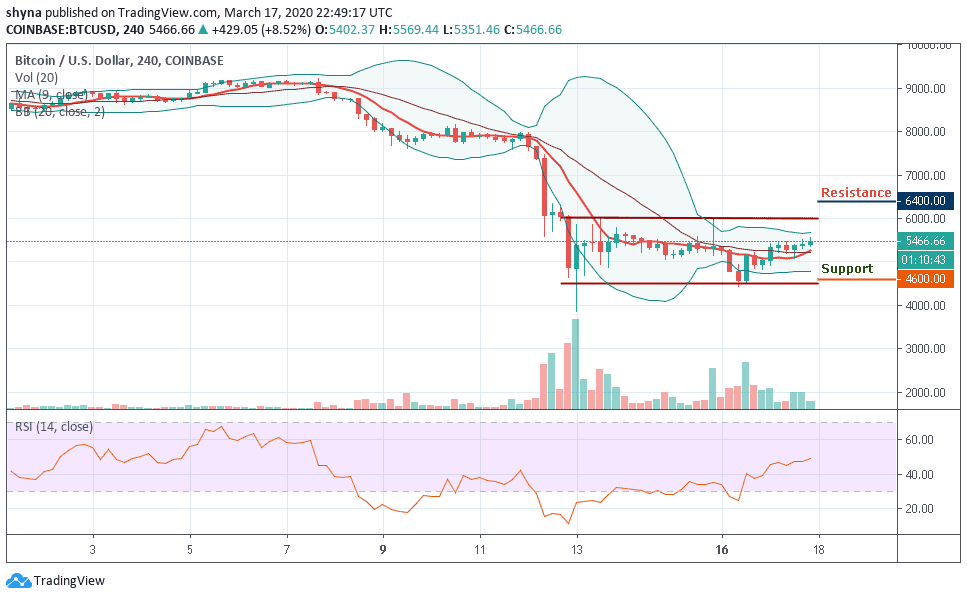
Conversely, the immediate support is around the $5,000 level while the main support is at the $4,800 level. The price may likely fall below $4,600 and beyond if the bears step back into the market. Technically, in the long-term, Bitcoin (BTC) is still moving in sideways while the RSI (14) follows the upward movement within the channel.
Please note: Insidebitcoins.com is not a financial advisor. Do your research before investing your funds in any financial asset or presented product or event. We are not responsible for your investing results.
Join Our Telegram channel to stay up to date on breaking news coverage