Join Our Telegram channel to stay up to date on breaking news coverage
Bitcoin (BTC) Price Prediction – October 17, 2020
Following the rejection at the $11,500 and $11,700 resistances, BTC/USD is range-bound between levels $11,200 and $11,440. This tight range will eventually lead to a breakdown or breakout. The current range-bound levels have been holding since October 16.
Resistance Levels: $10,000, $11,000, $12,000
Support Levels: $7,000, $6,000, $5,000

In the last 48 hours, Bitcoin bulls have been attempting to break the current range-bound zones but to no avail. The bears may attempt to break the lower price range which will result in the downward movement of the coin. Today, the coin is rising as it reached the high $11, 418 but has been repelled. On the 1-hour chart, the BTC price has been resting the $11,400 resistance to break above it.
The coin will face bearish reaction if it continues to retest the upper price range. On the upside, the critical support zones must hold for BTC to resume the uptrend. However, BTC selling pressure will resume, if the bears break below the support zones of $11,100, $11,200, and $11,300. The downward move may extend to the low of $11,000 if the bears have the upper hand.
Bitcoin (BTC) Indicator Analysis
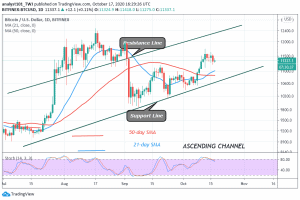
BTC price is fluctuating in the middle of the ascending channel. The price bars are well above the SMAs which indicates that the coin will rise. This is contrary to the daily stochastic which indicates that the coin is in a bearish momentum. That is it is below the 80% range of the daily stochastic.
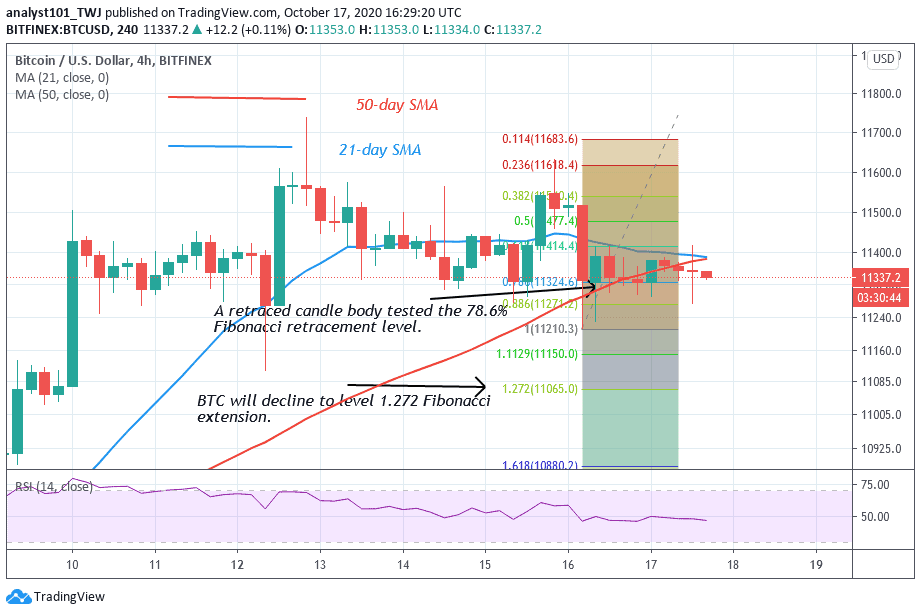
Meanwhile, Bitcoin is likely to resume a downward move as the price action indicates bearish signals. On October 16 downtrend, the retraced candle body tested the 78.6% Fibonacci retracement level. The retracement indicates that Bitcoin will further decline to level 1.272 Fibonacci extension. In other words, BTC will fall to a low of $11,065. The market will reverse at the $11,065 support and resume an upward move.
Join Our Telegram channel to stay up to date on breaking news coverage