Join Our Telegram channel to stay up to date on breaking news coverage
Bitcoin (BTC) Price Prediction – February 19
A few minutes ago, BTC/USD has plunged lower, just now losing the key $10,000 price level.
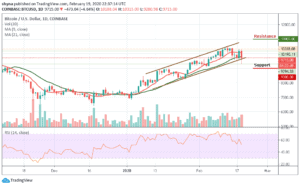
BTC/USD Long-term Trend: Bullish (Daily Chart)
Key levels:
Resistance Levels: $11,000, $11,200, $11,400
Support Levels: $9,000, $8,800, $8,600

As BTC/USD plunges to the south, the cryptocurrency traded as low as $9,583, falling nearly 4.64% from the local top at $10,318 seen earlier today. Just a few days ago, Bitcoin (BTC) was changing hands for $9,500; the fact the cryptocurrency remains at $9,900, above the ever-important $9,500 level, suggests bulls still remain in control. At the time of writing, BTC/USD continues to narrow down towards $9,500. The downtrend is clearly shown by taking a broader technical picture using the daily chart.
However, the bulls are struggling to hold a couple of important supports near $9,600. The price is likely to continue lower below the $9,200 and $9,100 support level if there is a downside break below the $9,500 support level, the price could revisit the $9,400 support level as the bears are forcing the bulls to obey the trend and there is a risk of a sharp decline to $9,000, $8,800 and $8,600 support levels once the market follows the downward trend.
In addition, the market is deciding below the 9-day and 21-day moving averages, where the buyers are anticipating a rebound. Meanwhile, the $10,500 and $10,700 levels may likely play out as the nearest resistances should the $10,000 level holds. However, a strong bullish spike might take the price to $11,000, $11,200 and $11,400 levels if the bulls can push the price above the moving averages. But presently, the RSI (14) is diving below the 53-level.
BTC/USD Medium – Term Trend: Bearish (4H Chart)
Bitcoin’s price is trading below the 9-day and 21-day moving averages around $9,653 after rebounding from $9,287 in today’s trading. Looking at the 4-hour chart, we can see that the bears are stepping back into the market, but the bulls are making effort to defend the $9,500 support. Meanwhile, the $9,200 support level and below may come into play if BTC breaks the above-mentioned support.
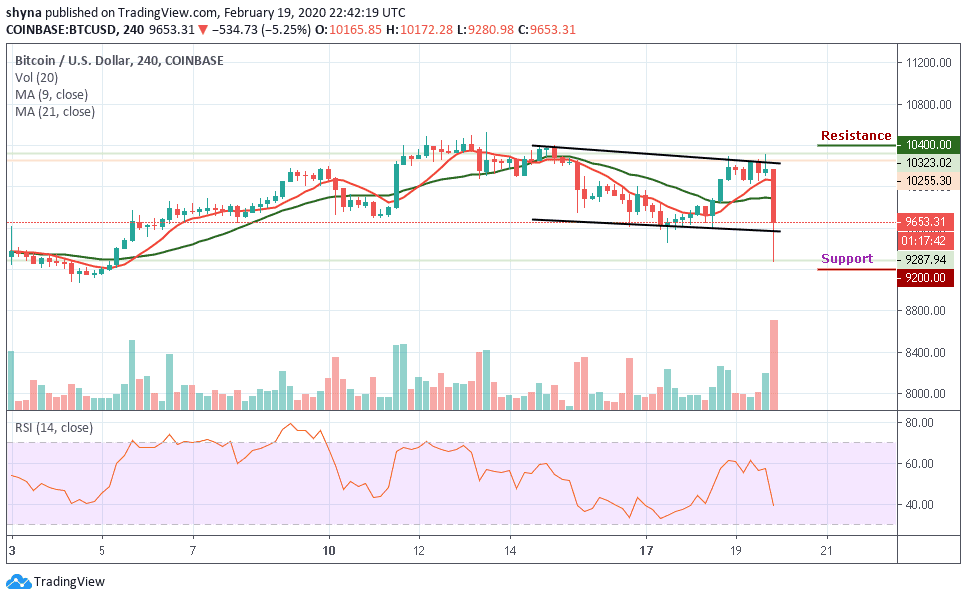
However, if the buyers put-in more effort and energize the market, we can expect a retest of $10,300 resistance level. Therefore, breaking the above-mentioned resistance could lead the bulls to hit the potential resistance of $10,400 and above. More so, the RSI (14) is about crossing the 40-level, more bearish signals may resurface in the market soon.
Please note: Insidebitcoins.com is not a financial advisor. Do your research before investing your funds in any financial asset or presented product or event. We are not responsible for your investing results.
Join Our Telegram channel to stay up to date on breaking news coverage