Join Our Telegram channel to stay up to date on breaking news coverage
Bitcoin Price Prediction – February 7
The Bitcoin price prediction reveals that BTC may cross above the upper boundary of the channel to touch the resistance level of $45,000.
BTC/USD Long-term Trend: Bearish (Daily Chart)
Key levels:
Resistance Levels: $50,000, $52,000, $54,000
Support Levels: $38,000, $36,000, $34,000
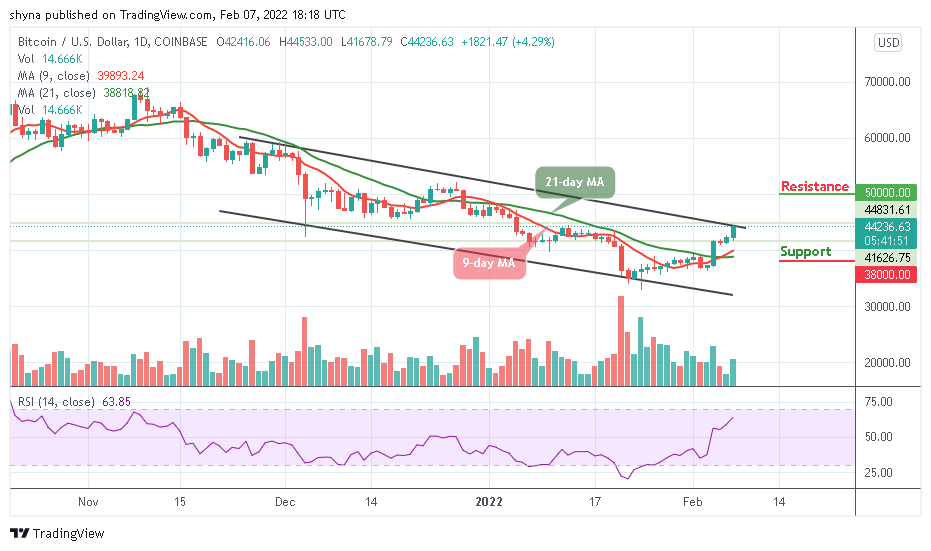
BTC/USD continues to move above the 9-day and 21-day moving averages as the coin gets ready to cross above the upper boundary of the channel. Looking at the daily chart, the 9-day MA crosses above the 21-day MA which shows that the king coin may be ready for the upward movement. However, the price of the leading crypto asset is now heading towards the north above the price level seen a couple of days ago.
Bitcoin Price Prediction: Bitcoin (BTC) Ready to Spike above the Channel
The Bitcoin price is seen moving above the crucial levels which may later function as the support levels for the crypto in the event of a reversal. On the upside, as the coin moves to break above the channel, little is in place to prevent correction targeting the key resistance of $45,000 as the technical indicator RSI (14) moves to cross into the overbought region.
Nevertheless, the king coin may be banking on the support at $40,000 to ensure that despite a reversal, the Bitcoin price stays above this level. Similarly, the nearest resistance levels to could be located at $50,000, $52,000, and $54,000 while the support levels may be found at $38,000, $36,000, and $34,000 respectively.
BTC/USD Medium – Term Trend: Bullish (4H Chart)
The 4-hour chart shows that the price is on its way up as the technical indicator Relative Strength Index (14) remains within the overbought region to confirm the uptrend. However, the bulls have been keeping the upward movement the price could hit the resistance level of $46,000.

Meanwhile, the support level of $42,000 and below may come into play if the price breaks below the 9-day and 21-day moving averages. However, if the buyers continue to power the market; they can push the price to the resistance level of $46,000 and above.
Looking to buy or trade Bitcoin (BTC) now? Invest at eToro!
68% of retail investor accounts lose money when trading CFDs with this provider
Read more:
Join Our Telegram channel to stay up to date on breaking news coverage