Join Our Telegram channel to stay up to date on breaking news coverage
Bitcoin Price Prediction – October 14
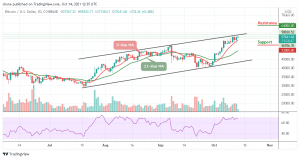
The Bitcoin price is up by moving close to the channel as the coin strikes a sudden and bullish price spike.
BTC/USD Long-term Trend: Bullish (Daily Chart)
Key levels:
Resistance Levels: $64,000, $66,000, $68,000
Support Levels: $53,000, $51,000, $49,000
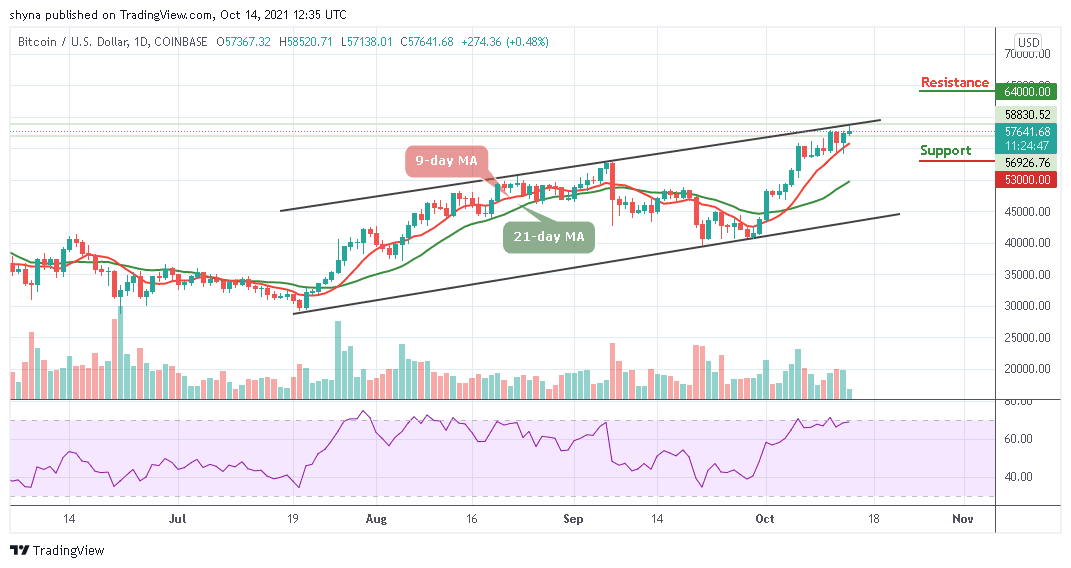
BTC/USD is pushing the price above the crucial resistance level of $57,500. The coin is moving towards $59,000 to trade at $57,641 at the time of writing. However, the number-one crypto is moving with strong bullish momentum after a sustainable break above an important technical level.
Bitcoin Price Prediction: Bitcoin (BTC) Ready to Blow Hot
As the Bitcoin price stays above the 9-day and 21-day moving averages, the return below $57,000 could set the framework for gains towards $60,000. Meanwhile, the technical analysis shows that the bulls are ready for action especially when the up-trending Relative Strength Index (14) is considered. Therefore, any further bullish movement above the upper boundary of the channel could pave the way for gains above $60,00 before reaching the resistance levels of $64,000, $66,000, and 68,000 respectively.
At the downside, if the price falls back below the $55,000 level and move to cross below the 9-day moving average, the bears may wrestle out control over the situation very quickly as this may likely serve as a major blow for the market sentiments as traders could interpret it as a sign of underlying weakness. Therefore, the next critical support may come at $54,000, which may be followed by $53,000, $51,000, and $49,000 support levels.
BTC/USD Medium – Term Trend: Bullish (4H Chart)
The 4-hour chart reveals that the market is currently showing a sign of weakness as the price couldn’t spike towards the channel. However, the intraday trading is looking bullish but following the recent rebound at $57,346 which is the key support level. If the coin keeps trading above the 9-day and 21-day moving averages, it could meet the next key resistance level at $61,000 and above.
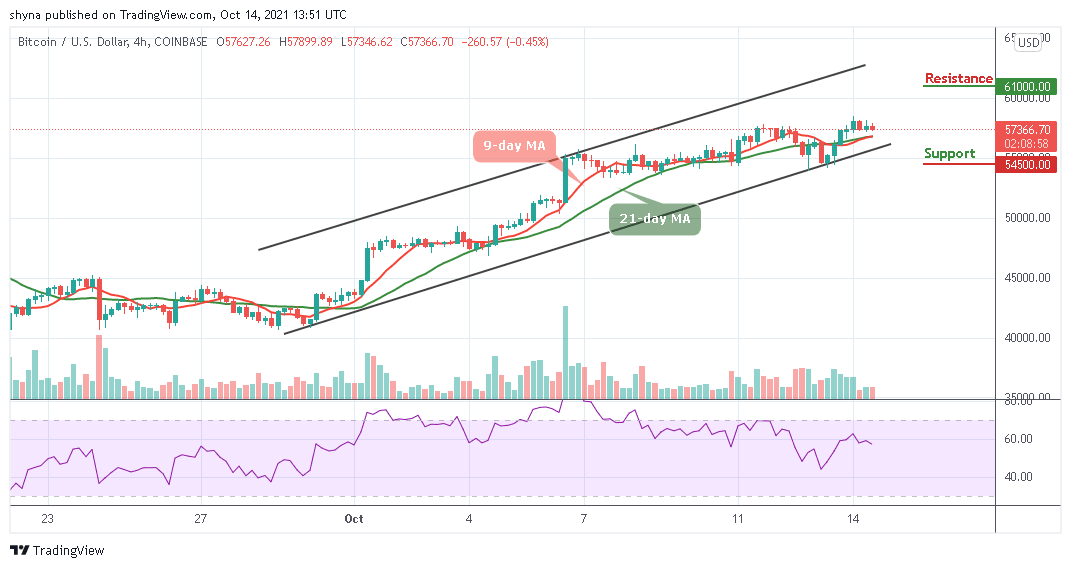
However, considering the sideways movement, the Bitcoin price may re-enter the bearish rally to $55,000 support. A drop below the mentioned support may further bring the Bitcoin price below the lower boundary of the channel to hit the support level of $54,500 and below. In addition, the technical indicator Relative Strength Index (14) faces down, suggesting downward movement.
Looking to buy or trade Bitcoin (BTC) now? Invest at eToro!
67% of retail investor accounts lose money when trading CFDs with this provider
Read more:
Join Our Telegram channel to stay up to date on breaking news coverage