Join Our Telegram channel to stay up to date on breaking news coverage
Bitcoin Cash (BCH) Price Analysis – July 5
The latest bear market in the entire crypto space has made most altcoins to see serious bleeding. Bitcoin Cash as well has experienced a substantial price decrease over the past few days, bringing the current price to around $400 with a 21.5% loss. Still trending low, we can expect a rise following a trend reversal in the market.
BCH-USD Market
Key Levels:
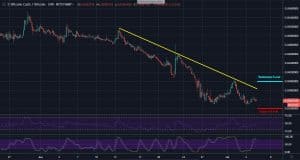
Resistance levels: $422, $440
Support levels: $380, $370
Against the Dollar, the price of Bitcoin Cash fell heavily near the $380 low after making a double-top pattern around the $515 in late June. BCH price is trading at around $400 as of the press time as the market continues to sell. After the massive decline, the fifth best performing crypto has remained in a descending triangle boundary.
Currently, we are about to see a price drop to $380 support. BCH, however, has been trading below the RSI 50 level since the bearish surge. If the market follows the bullish signal on the Stochastic RSI; the price may retest $422 resistance on a breakout, followed by $440. A break below the triangle could slump BCH to $370
BCH-BTC Market
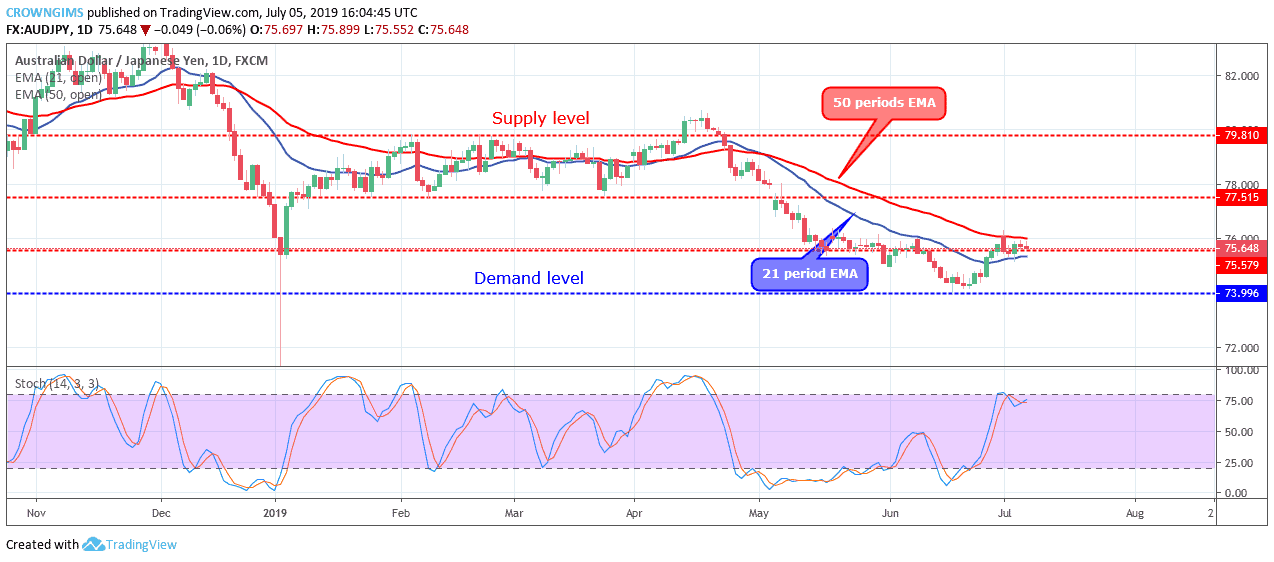
Against Bitcoin, BCH trading is still maintaining the downward movement as the price actions continue to flirt below the yellow descending resistance. As suggested in the price chart, selling pressure is strongly dominant in the market. This pair is likely to sell to 0.034BTC and 0.032BTC supports if the supply continues to outweigh demand.

Bitcoin Cash appeared bearish on the RSI after falling from near the 70 line. A strong buy could take the price to 0.04BTC resistance after surpassing 0.038BTC level, where the yellow trend line lies. A break above the 0.04BTC could set the market on a bull-run. As confirmed on the Stochastic RSI, the trade is about to present another decline.
Please note: insidebitcoins.com is not a financial advisor. Do your own research before investing your funds in any financial asset or presented product or event. We are not responsible for your investing results.
Join Our Telegram channel to stay up to date on breaking news coverage