Join Our Telegram channel to stay up to date on breaking news coverage
XRP Price Prediction – December 7
XRP is making an attempt to keep its upward movement as the bulls fail to move the cryptocurrency to a new monthly height.
XRP/USD Market
Key Levels:
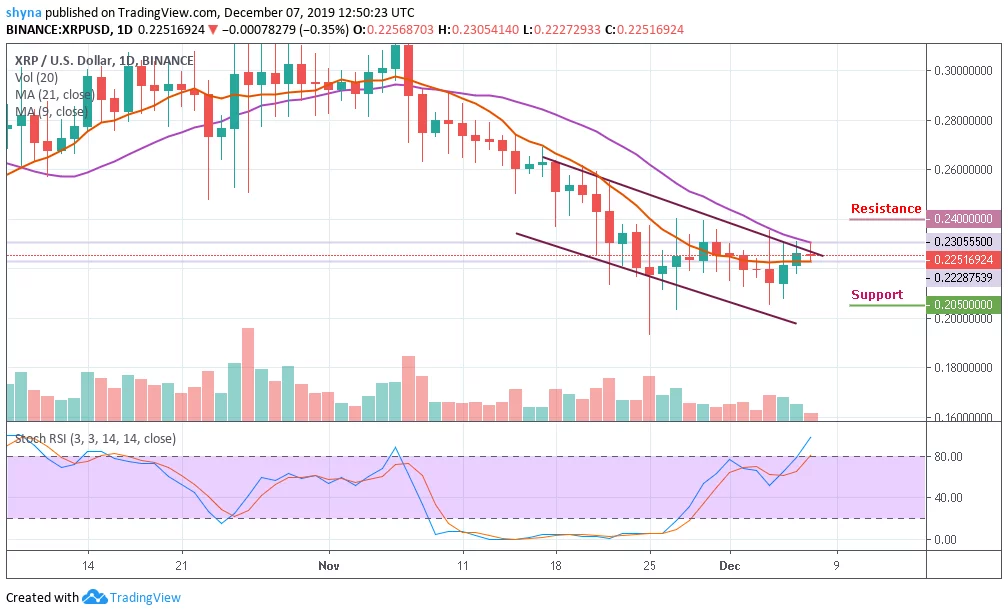
Resistance levels: $0.240, $0.250, $0.260
Support levels: $0.205, $0.195, $0.185

Ripple (XRP) is one of the cryptocurrencies that is pushing for the end of the week’s recovery. The Asian session is characterized by a loss of 0.35% on the day. XRP/USD is trading at $0.225, although it opened today’s session at $0.226, the bulls are intentional in their muscle-flexing. For instance, a break above the channel and the 21-day MA on the daily chart means that XRP bulls are coming up.
The price of ripple broke through the downtrend a few weeks ago, might be the possible end of the downward trend.
Moreover, XRP/USD is on the verge of charting three bullish days in a row, breaking above the downward trending line in the process. So far so good for the forex brokers, as the market opens today, the coin has gone up slightly from $0.2265 to $0.227. Currently, the price is negotiating with resistance at the 9-day moving average. The stochastic RSI indicator shows increasing bullish momentum.
However, a significant cross above the channel could sustain the bulls to $0.230 and $0.235 highs . Meanwhile, Ripple is currently facing an upward trend and still maintaining it and this is the better time to buy Ripple. If XRP manages to surge above $0.235, it may see resistance at $0.240, $0.250 and $0.260, though a further drop may bring it to the support levels of $0.205, $0.195 and $0.185 respectively.
When compared withBitcoin trading, XRP is still trading on the downside, although the price action has remained intact within the symmetric triangle. If the selling pressure persists, the XRP price variation may likely create a new low in the coming days. For now, the RSI (14) has decided to be moving in the same direction above 40-level; we may see a negative move in the market soon.
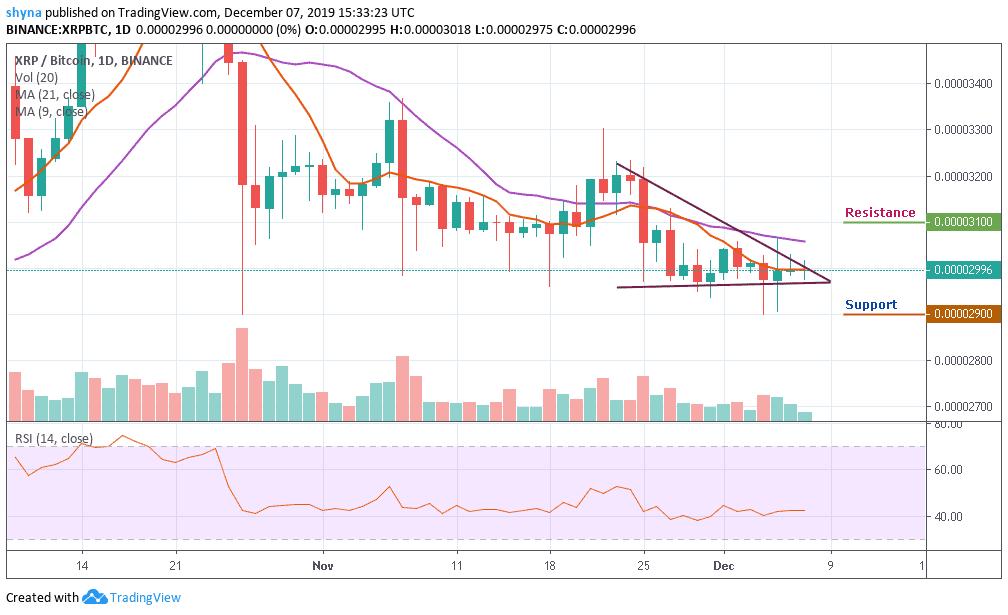
However, the coin is currently trading around the 9-day moving average but below the 21-day moving average at 2996 SAT. We can expect close support at the 2950 SAT before breaking to 2900 SAT and potentially 2850 SAT levels. If a bullish move occurs and validates a break significantly above the symmetric triangle; we can then confirm a bull-run for the market and the closest resistance levels lie at 3100 SAT and above.
Please note: Insidebitcoins.com is not a financial advisor. Do your research before investing your funds in any financial asset or presented product or event. We are not responsible for your investing results.
Join Our Telegram channel to stay up to date on breaking news coverage