Join Our Telegram channel to stay up to date on breaking news coverage
ETH Price Prediction – December 7
The price of Ethereum seems to be showing more bearish signs throughout the short-term consolidation phase seen in recent days
ETH/USD Market
Key Levels:
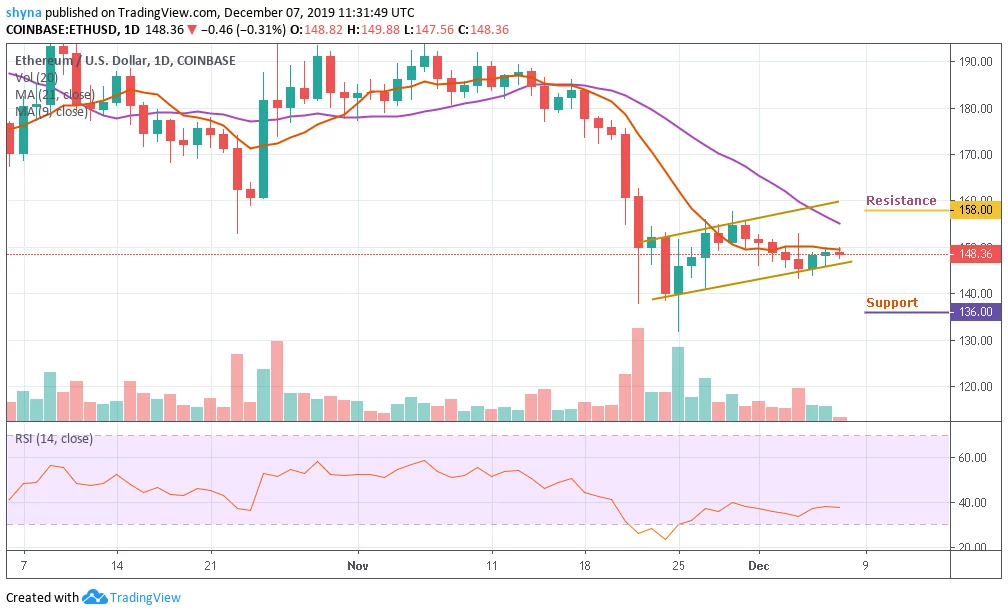
Resistance levels: $158, $163, $168
Support levels: $136, $131, $126
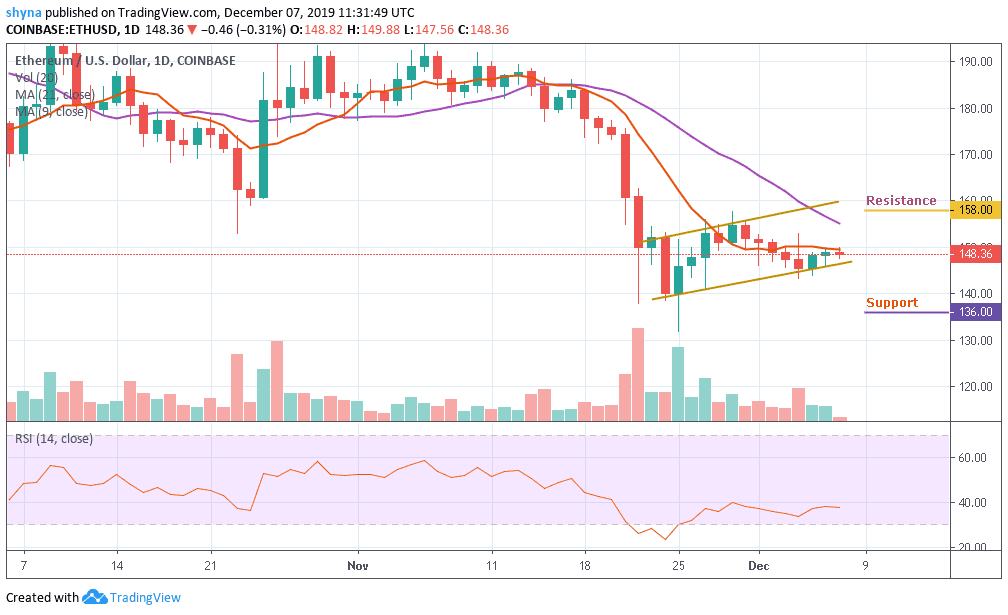
ETH/USD has been dropping with a bearish bias for the better part of the day. The coin opened at $148.86 today and initially dropped below $148 before striking a surge above $148.86 touching $149. It gradually pulled back to $148.5 and kept trading around $147 but yesterday; ETH/USD broke below $147 and touched $146.43.
The price of the ETH/USD is currently experiencing a price drop as the coin is been bitten by the bears. Traders were expecting a lot from the crypto, although December 5 and 6 reflected an improvement in ETH prices. The daily chart reveals that both the Ethereum and the Bitcoin started with a fall today. More so, the price is currently moving under the 9-day moving average but very far from the 21-day moving average while exchanging hands at $148.36 which is yet to break the lower boundary of the channel.
In addition, a bearish drop may likely roll the market down to $136, $131 and $126 support levels while possible bullish surge may drive the market to $155 level, testing the 21-day moving average. Above this, $158, $163 and $168 may further provide resistance levels for the market. Meanwhile, the RSI (14) is moving below 40 and staying there may cause the coin to remain below the $150 level.
When compared with Bitcoin, the market price remained in the descending channel and the bears have already taken over the market. ETH/BTC is currently trading at 0.0196 BTC and the bulls couldn’t push the price upward. Looking at the chart, if the market continues to drop, the next key supports may likely be at 0.0190 BTC and below.
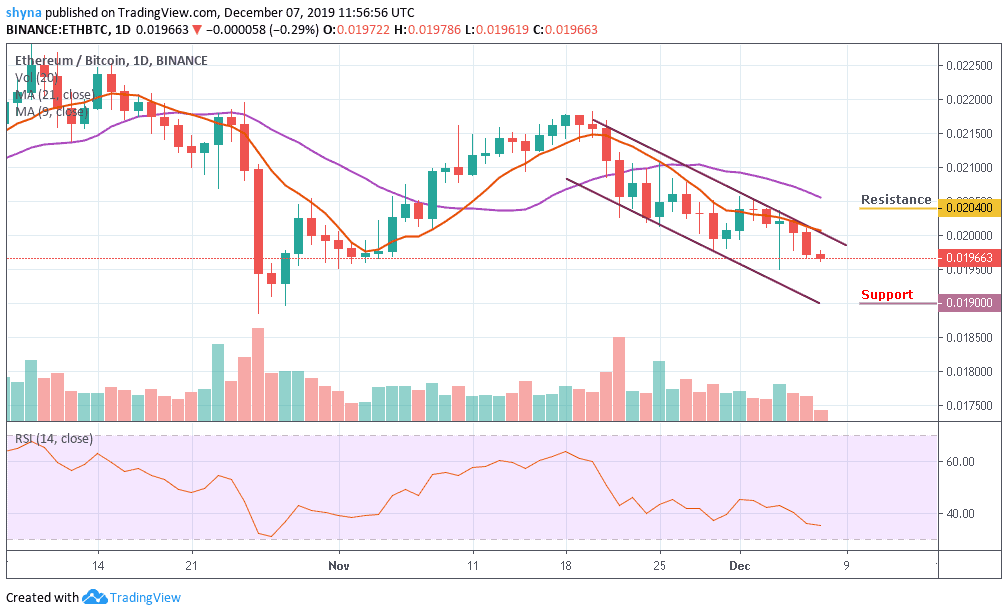
However, on the upside, a possible bullish movement could push the market towards the 9-day moving average around the upper boundary of the channel, when this is done, the resistance level of 0.0204 BTC and above could be visited but the RSI (14) is moving below 40 and this indicates that the market may continue to fall.
Please note: Insidebitcoins.com is not a financial advisor. Do your research before investing your funds in any financial asset or presented product or event. We are not responsible for your investing results.
Join Our Telegram channel to stay up to date on breaking news coverage