Join Our Telegram channel to stay up to date on breaking news coverage
LTC Price Prediction – December 5
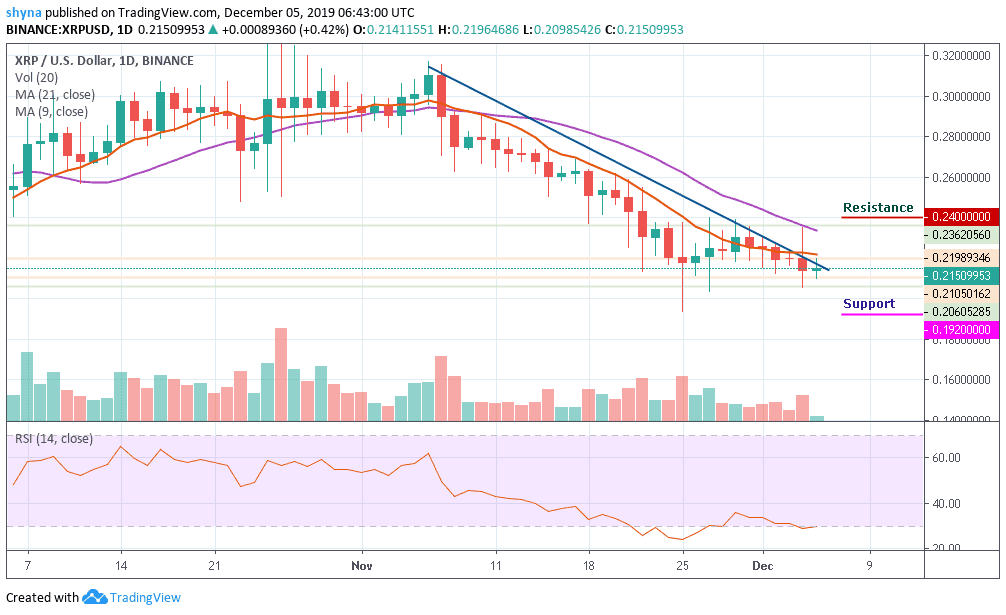
Litecoin maintains its price around $44 despite the 0.34% gain within the last 24 hours. The price may likely touch $46 as its next resistance.
LTC/USD Market
Key Levels:
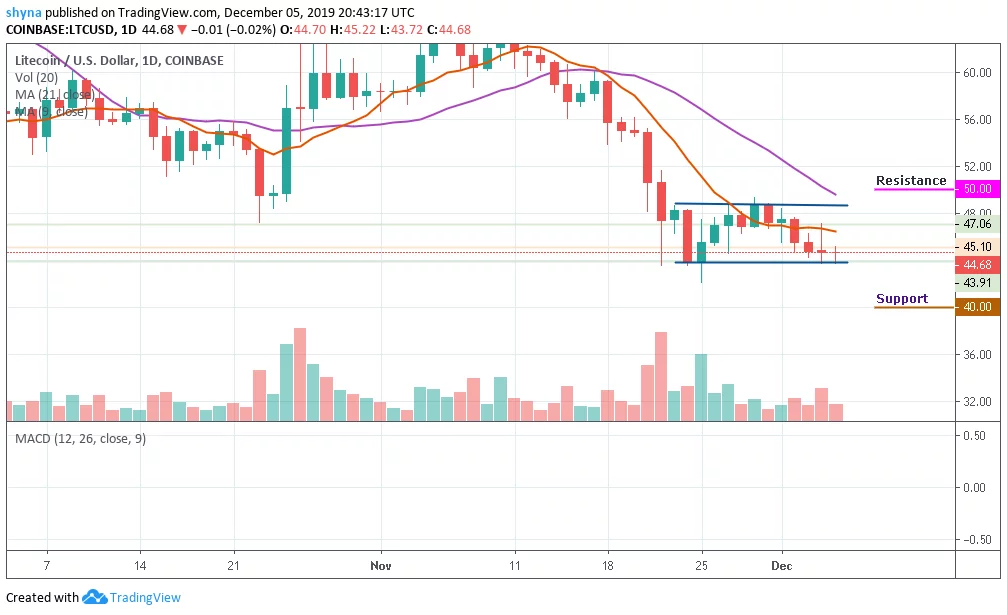
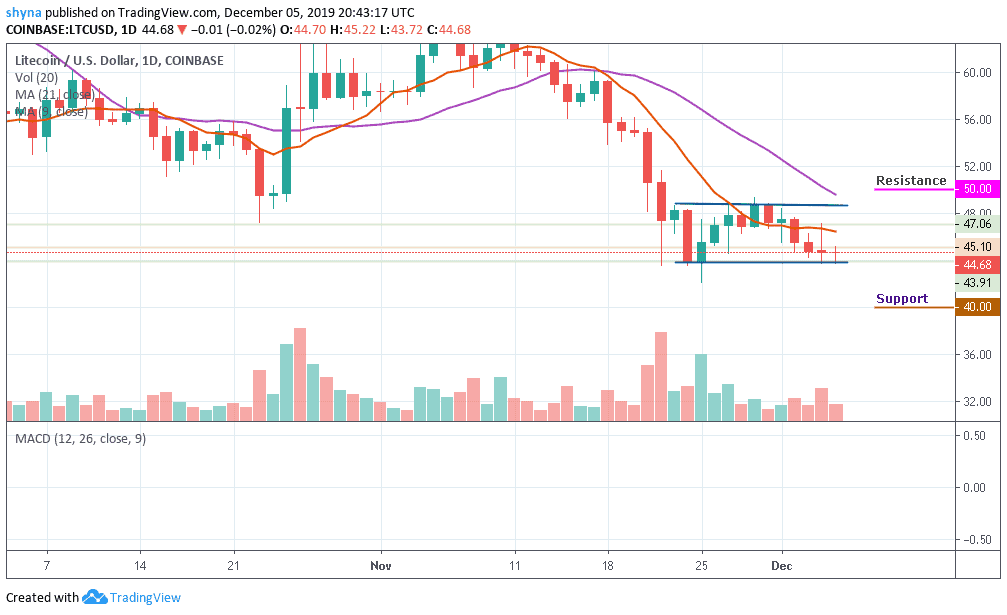
Resistance levels: $50, $52, $54
Support levels: $40, $38, $36
LTC/USD is still trapped in an incredibly narrow trading range after a bullish rally failed to materialize. In fact, the cryptocurrency is trading in its tightest eleven days trading band since late last month year. An early day rally towards the $46 level failed to generate sustainable gains, with the LTC/USD pair soon slipping back under the $45 level. You can find the details about buying litecoin on the best trading platforms here.
The more the LTC/USD pair fails to recover from the current trading levels, the greater the chances that we will see cryptocurrency falling to a new multi-month trading low. A break below the $42 support level may provoke an even deeper decline towards the $40, $38 and $36 levels. Short-term technical analysis shows that the $44 and $43 levels are currently the strongest forms of technical support before the $41 level starts to come into focus.
Moreover, the daily chart highlights that the LTC/USD pair’s 9-day moving average, at the $46 level, is a key technical region which bulls need to break. The cryptocurrency’s 21-day moving average is located at the $50, $52 and $54 resistance levels, and a move above this key technical metric should encourage further LTC/USD buying.
Furthermore, the MACD for LTC is still in the negative zone, which still shows signs of weakness in the market.
Against BTC, looking at the price movement, we can see that Litecoin is significantly bearish on the daily price chart. Now that the price is falling, the sellers are posing more threat to the 6046 SAT support level where the nearest target lies. However, an eventual break may lead to the collapse of Litecoin.
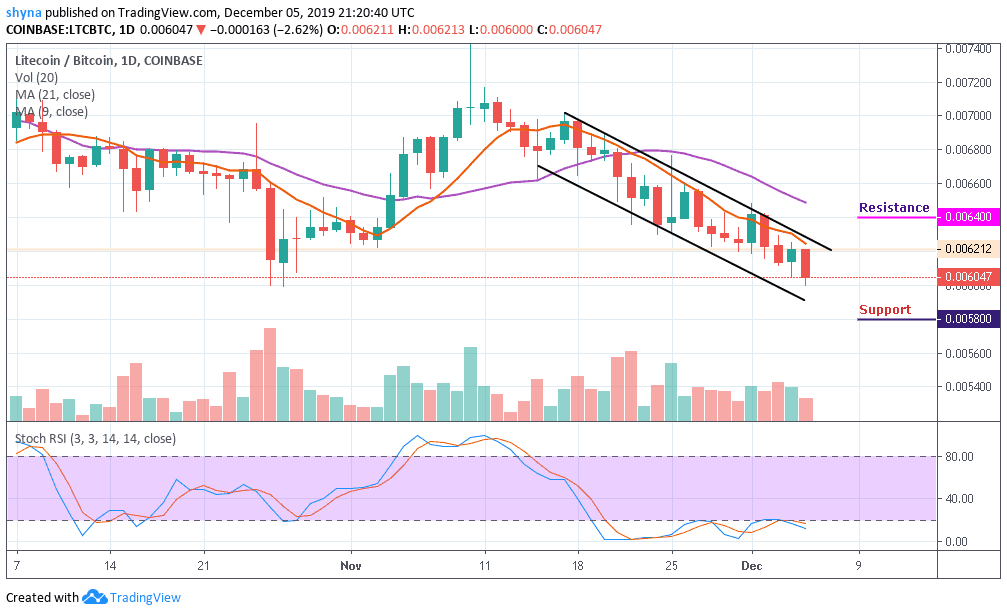
However, a further bearish continuation will likely meet the major support at 5800 SAT before falling to 5700 SAT and 5600 SAT while the buyers may likely push the market to the critical potential resistance at 6400 SAT, 6500 SAT and 6600 SAT respectively. The stochastic RSI has remained inside the oversold territory. LTC will continue to drop if the sellers continue to release the pressure.
Please note: Insidebitcoins.com is not a financial advisor. Do your research before investing your funds in any financial asset or presented product or event. We are not responsible for your investing results.
Join Our Telegram channel to stay up to date on breaking news coverage