Join Our Telegram channel to stay up to date on breaking news coverage
XRP Price Prediction – December 5
XRP/USD is vulnerable to further losses as long as it stays below $0.220 while the nearest support is located on the approach to $0.210.
XRP/USD Market
Key Levels:
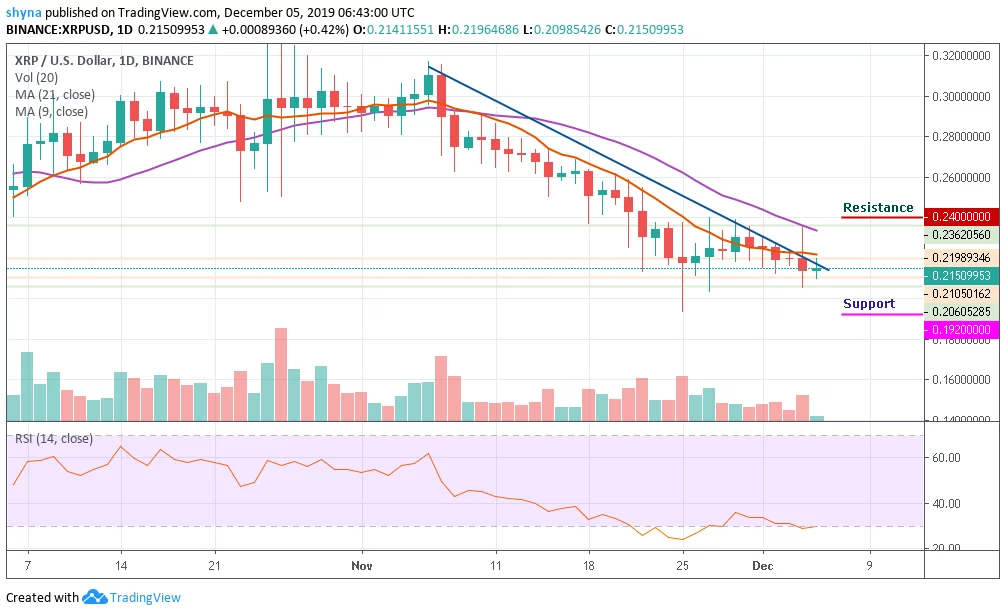
Resistance levels: $0.240, $0.250, $0.260
Support levels: $0.192, $0.182, $0.172
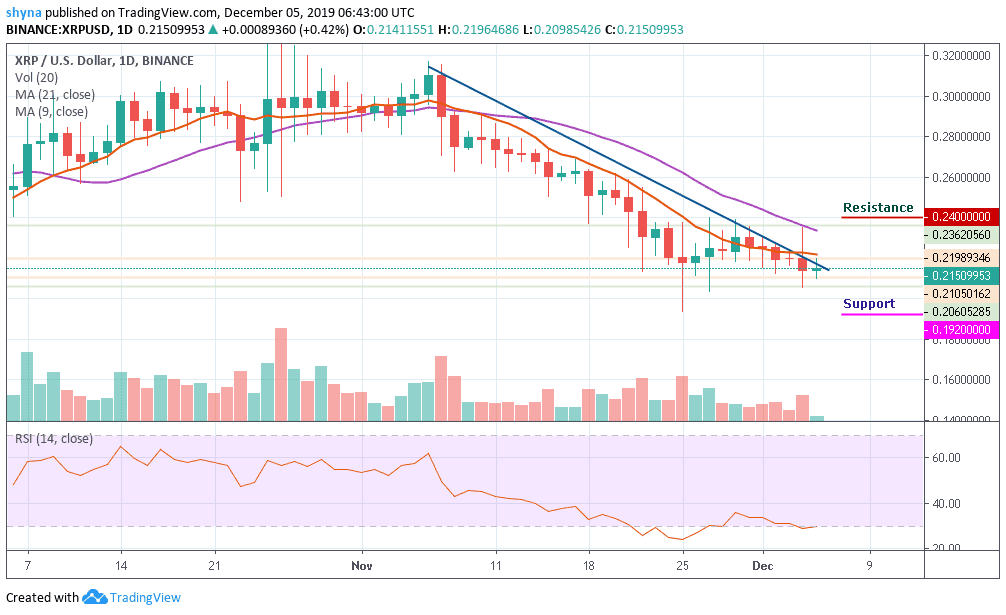
Today, Ripple’s XRP bottomed at $0.2105 during early Asian hours and now recovering to $0.2150 by the time of writing. Compared to yesterday’s trading, XRP/USD has gained 0.42% as the market opens today. Although, the current movement is still below the 9-day and 21- moving averages but If the bulls can manage to engineer a sustainable recovery above this handle, the short-term movement will improve slightly, while the coin will get a chance for an upside move towards $0.2250.
Looking at the chart technically, XRP may likely experience more losses as long as it stays below $0.220. Ripple has recently crossed below the $0.210 level which has contributed to the downward movement. It has been so long since Ripple Price maintained a bullish sentiment and stood at least above $0.235. Over the past few days, the price of the XRP has collapsed to trade regularly below $0.230 level, but apparently, there is still no price surge against the US dollar.
However, the daily chart has revealed that the sellers are still dominating the market with a heavy surge. For now, the key support level to watch out for lies at $0.192 and $0.182. A further drop may slip price to $0.172 support level. For a retracement move, the $0.220 level is likely to resurface before the rally continues. If the $0.220 could now contain the retracement, the price may further swing to $0.240, $0.250 and $0.260 resistance levels. The RSI (14) is moving below 40-level, indicating an oversold phase.
Against Bitcoin, the situation is becoming bleak as the market was previously trading above the 9-day moving average at 3025 SAT. The XRP/BTC was unable to break above this resistance level, causing a drop down to 2976 SAT as of yesterday. The market opens today with a downward trend and it has dropped to 2934 SAT at the time of writing.
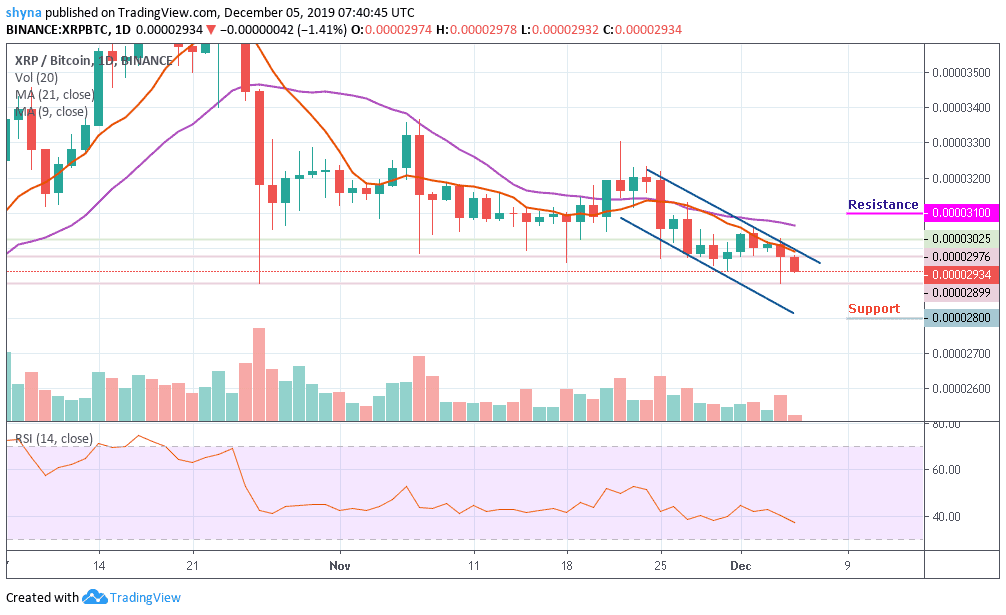
From upside, the nearest level of resistance lies at 3025 SAT, if the bulls can break above this level, further resistance may be found at 3100 SAT and 3200 SAT but if the sellers continue to push the price beneath the current 2934 SAT, the next level of support is located at 2890 SAT and more support is found at 2800 SAT and 2700 SAT. The RSI (14) has crossed below 40-level as the bears gain control of the market.
Please note: Insidebitcoins.com is not a financial advisor. Do your research before investing your funds in any financial asset or presented product or event. We are not responsible for your investing results.
Join Our Telegram channel to stay up to date on breaking news coverage