Join Our Telegram channel to stay up to date on breaking news coverage
Quant (QNT) Price Prediction – October 9
Buyers’ reactions in the Quant trading operations are on the high as the QNT/USD market is firmly mooning above the logical trading line at $140. In the last four years, price has witnessed an all-time low of $0.1636 and its all-time high stands around $428.38 since September 11, 2021. There is a positive percentage rate of 4.67 as of the time of writing.
QNT Price Statistics:
STORJ price now – $155.78
STORJ market cap – $1.9 billion
STORJ circulating supply – 12.1 million
STORJ total supply – 14.6 million
Coinmarketcap ranking – #31
Quant (QNT) Market
Key Levels:
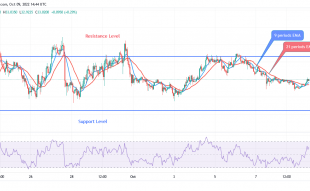
Resistance levels: $170, $180, $190
Support levels: $130, $120, $110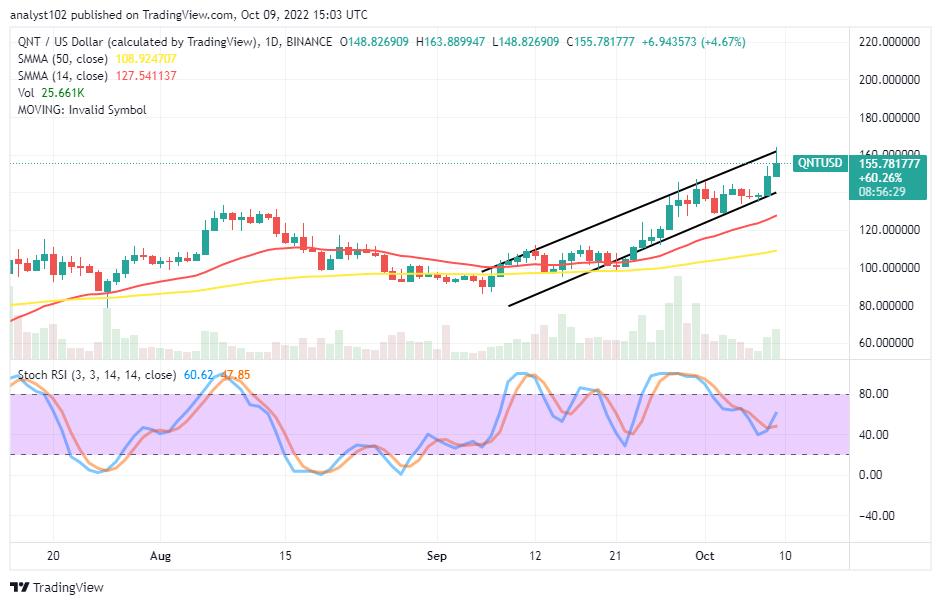 QNT/USD – Daily Chart
The QNT/USD market is firmly mooning over the $140 psychological trading level, as depicted on the daily chart. The bullish channel trend lines have been to ascertain the north path price is keeping over the trend lines of the SMAs. The 14-day SMA indicator is at a $127.54 value point, over the $108.93 value line of the 50-day SMA indicator. The Stochastic Oscillators have initially traveled southbound to the 40 range to attempt crossing northbound back at 47.85 and 60.62 range values.
Your capital is at risk
How strong is the current upward-moving potential in the QNT/USD market activity?
The crypto market is firmly mooning above the $140 logical high-trading zone, and signals are still strong in the potential upward trend in QNT/USD market activity. As indicated by the posture of the Stochastic Oscillators, it appears some gravity to the upside will be obtained beyond its current trading point in the near subsequent sessions. However, buyers should be cautious of a violent southbound reversal against the value line.
On the downside of the technical analysis, high-resistance trading points between $160 and $180 may be the zones where the market is likely to hit a peak point before facing a series of rejections that can give bears the leverage to launch back their presence afterward. Short-position placers may need to wait for the formation of two or three 1-hour bearish candlesticks at a higher-trading resistance zone to confirm the possibility of the market falling back into a correction.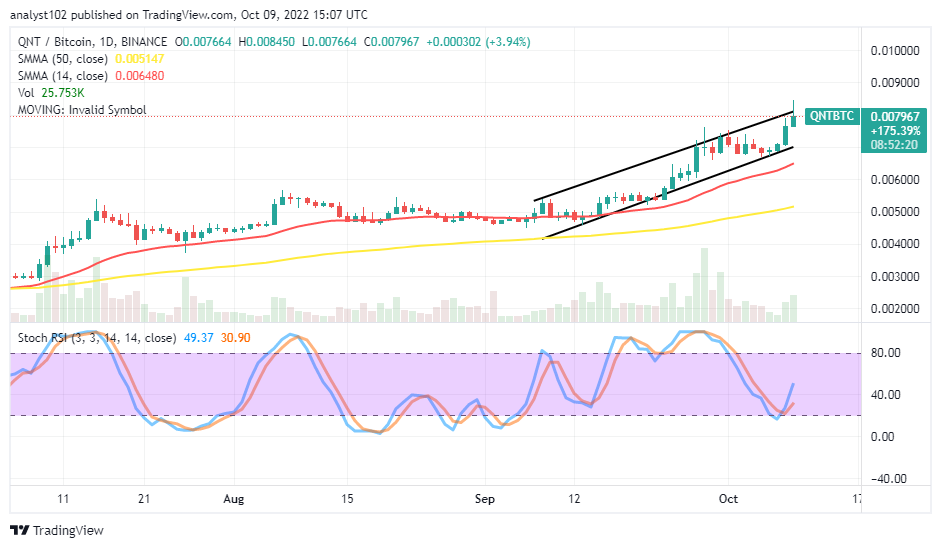
QNT/BTC Price Analysis
In the past several sessions, bullish channel trend lines established above the trend lines of the SMAs have continued to build upward-moving velocity, supporting Quant’s trending capacity prognosis against Bitcoin. The 14-day SMA indicator is above the 50-day SMA indicator. And they are separated by a notable space. The Stochastic Oscillators have crossed northbound against the range of 40 to point to the upside at 30.90 and 49.37 range values. That suggests the base cryptocurrency may be on for a while to take positions against the counter-trading cryptocurrency.
Read more:
- How to buy Quant
- How to buy cryptocurrency
Join Our Telegram channel to stay up to date on breaking news coverage