Join Our Telegram channel to stay up to date on breaking news coverage
Ranging movement in Solana market
Solana Price Analysis – October 09
In case there is a breakout at the resistance level of $34, price may increase to the resistance level at $38 which may increase to $39. On the other hand, when the $31 level holds not, Solana may decrease to the support levels at $31, $28 and $25. Meanwhile, the relative strength index period 14 is at 49 levels displaying no specific direction.
SOL/USD Market
Key Levels:
Resistance levels: $34, $38, $39
Support levels: $31, $28, $25
SOL/USD Long-term Trend: Ranging
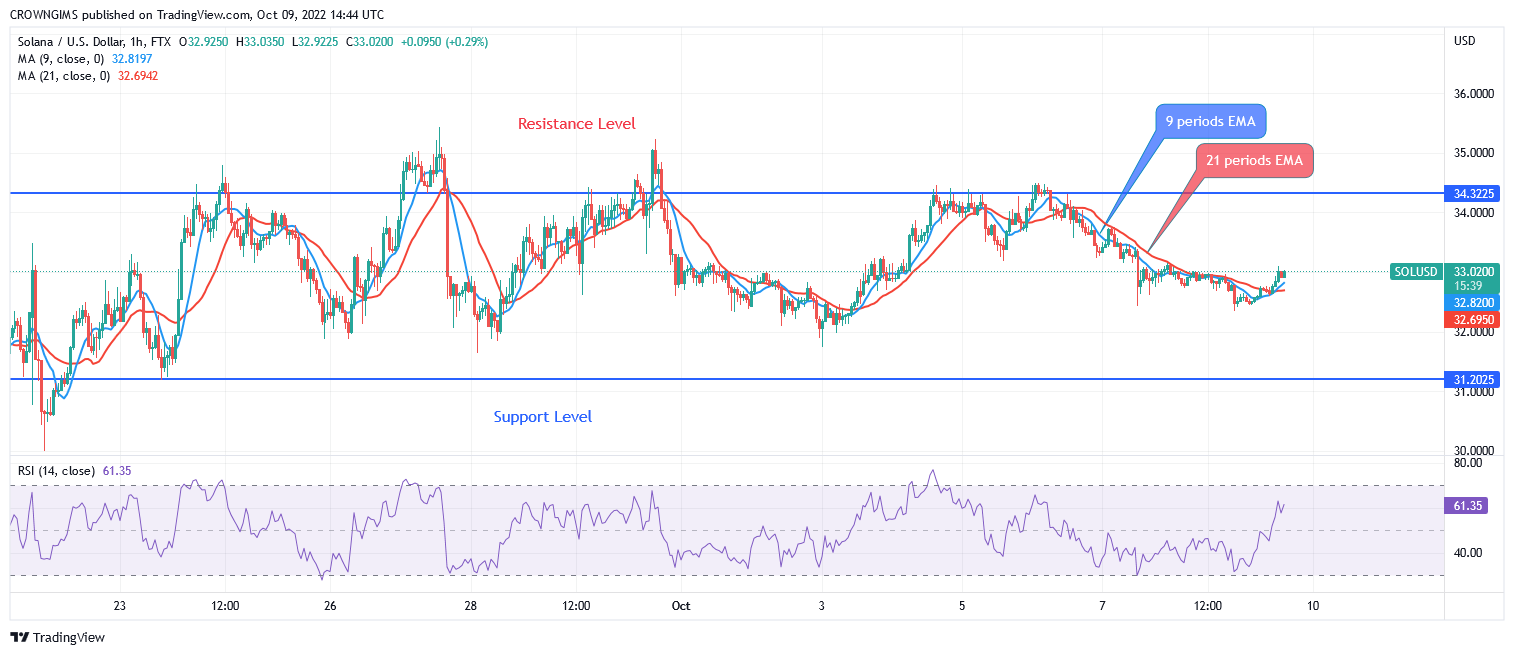
Solana is on ranging movement on the daily chart. Since September 18, when the price decreased to the support level of $31. Solana has been trading within the range of $34 and $31 levels. Attempts made by sellers to break down $31 level was interrupted by the buyers, then, the price is pushed up to $34 level. Likewise, when the buyers pushed up the price to break up $34 level, it was disrupted by the sellers, hence, ranging movement is ongoing in the Solana market,
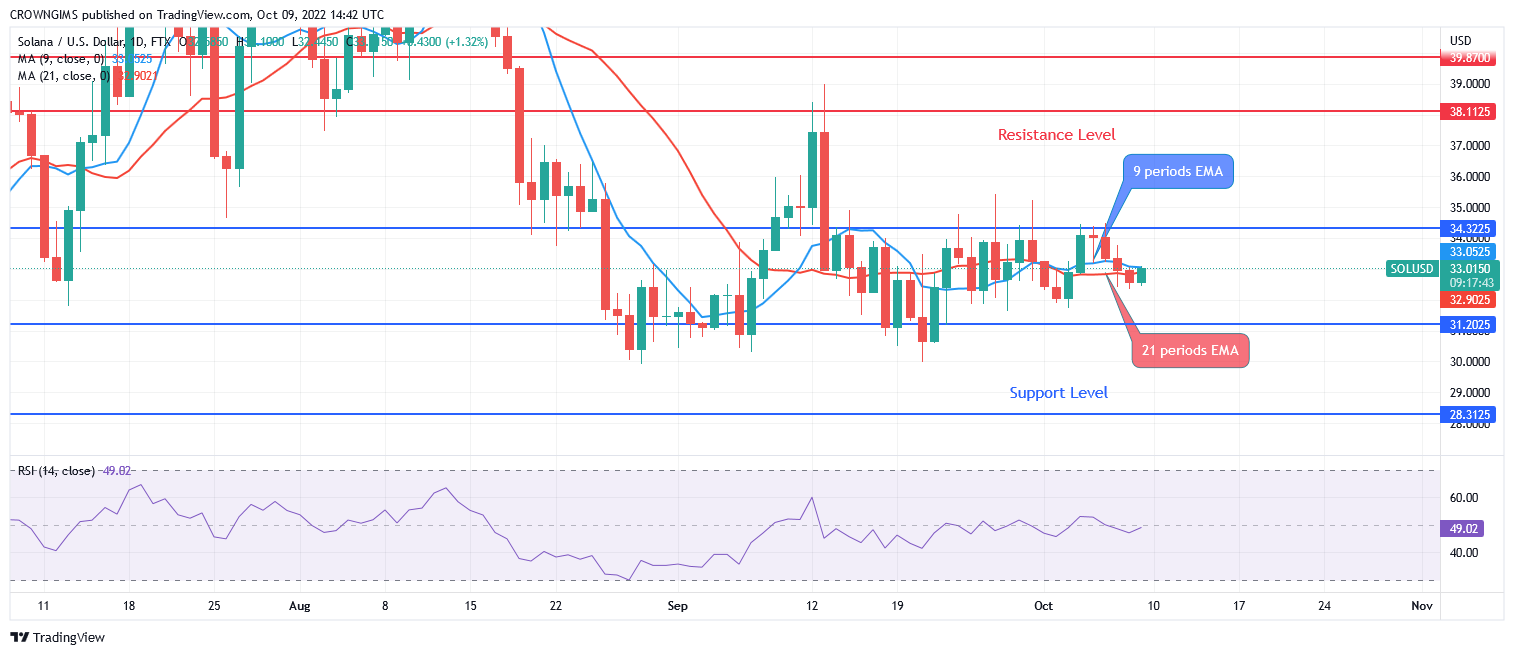
Buyers and Sellers were struggling with each other as the price is trading over and around the 9 periods EMA and 21 periods EMA. In case there is a breakout at the resistance level of $34, price may increase to the resistance level at $38 which may increase to $39. On the other hand, when the $31 level holds not, price may decrease to the support levels at $31, $28 and $25. Meanwhile, the relative strength index period 14 is at 49 levels displaying no specific direction.
Your capital is at risk
SOL/USD Medium-term Trend: Ranging
On the 4-hour chart, Solana’s performance is ranging. The trading of the coin is neither bullish nor bearish. It seems the momentum of sellers is equal to the momentum of buyers and this is what leads to ranging movement within the resistance level of $34 and support level of $31. Breakout is eminent.
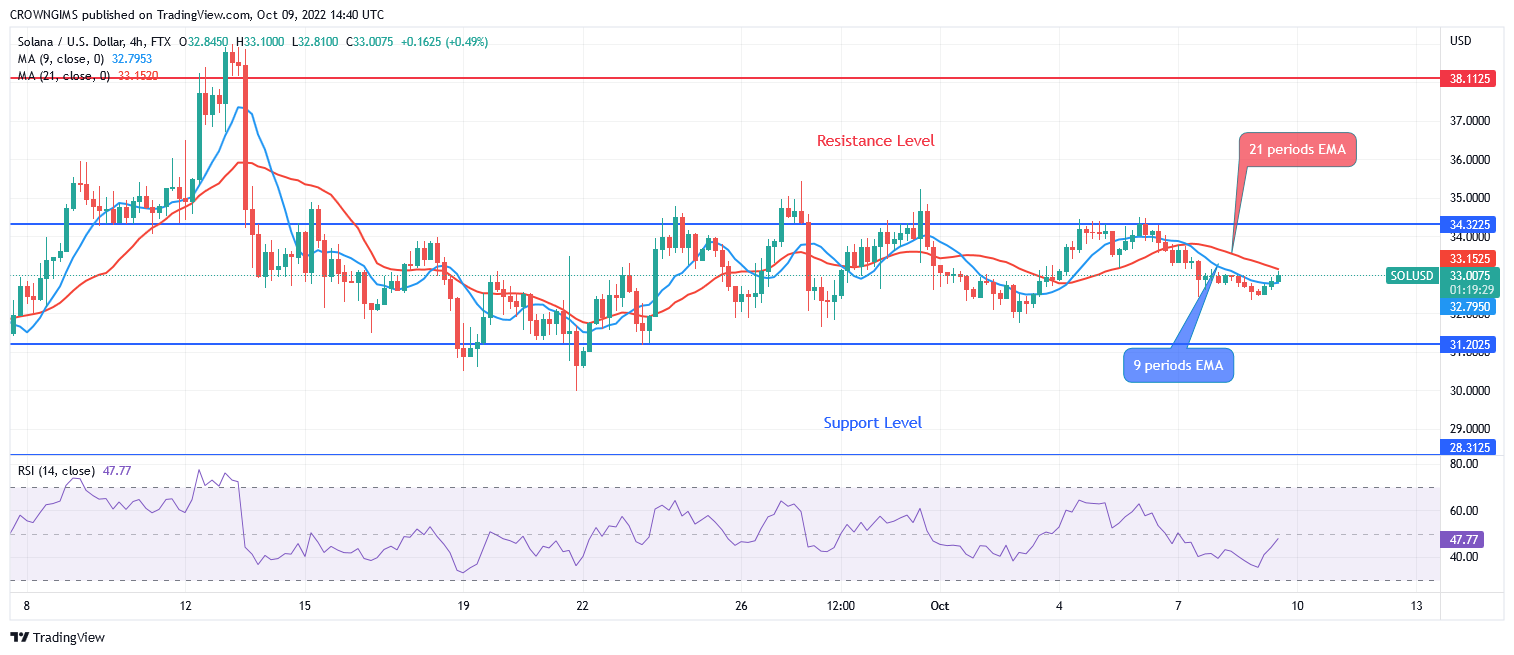
However, the relative strength index period 14 is at 48 levels and the signal line pointing up to indicate the buy signal.
Join Our Telegram channel to stay up to date on breaking news coverage