Join Our Telegram channel to stay up to date on breaking news coverage
LTC Price Prediction – March 12
The Litecoin price is currently changing hands at $220.70. The RSI (14) indicator moves toward the north.
LTC/USD Market
Key Levels:
Resistance levels: $260, $280, $300
Support levels: $160, $140, $120
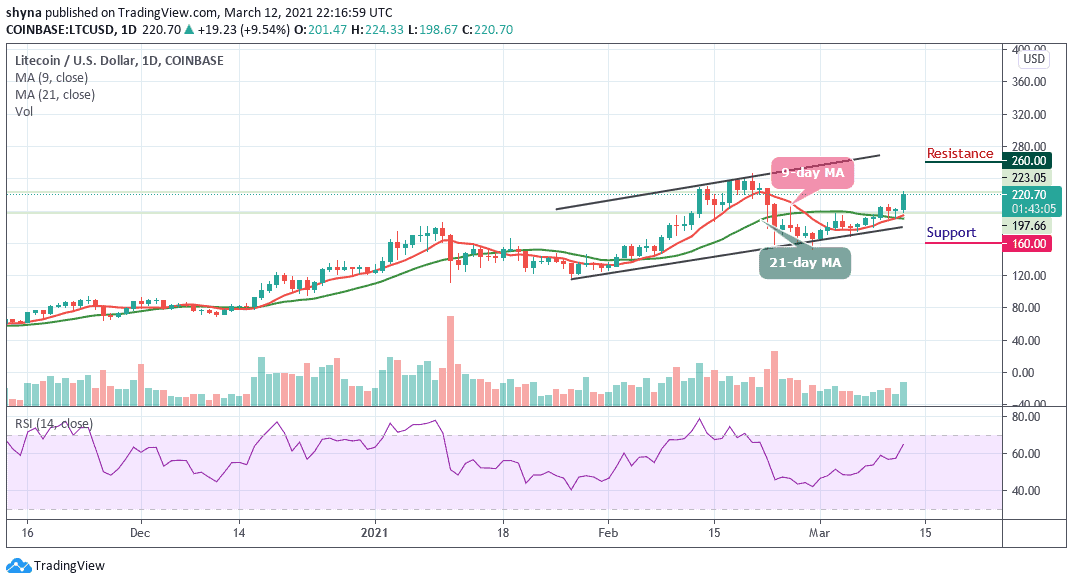
LTC/USD is currently trading at around $220. Once it manages to surpass the current resistance, the next target is at $224 where it touched a few hours ago. More so, a breach from here may send the price straight to around $250 but if this level fails to hold strong, the price could slip back below the 9-day and 21-day moving averages.
What is the Next Direction for Litecoin?
The daily chart shows that bulls are now gaining back control of the market. Meanwhile, if the bulls continue with the upward movement, the market price may likely hit the resistance levels of $260, $280, and $300 respectively. More so, any bullish movement above these key resistance levels should, therefore, encourage further buying.
However, the 9-day MA is crossing above the 21-day moving average; on the other hand, a break below the lower boundary of the channel may provoke an even deeper decline towards the $160, $140, and $120 support levels. Meanwhile, looking at the technical indicator RSI (14), Litecoin may exhibit the tendencies to follow an upward trend as the signal line moves towards the 70-level which may cause the market to remain stable at the average.
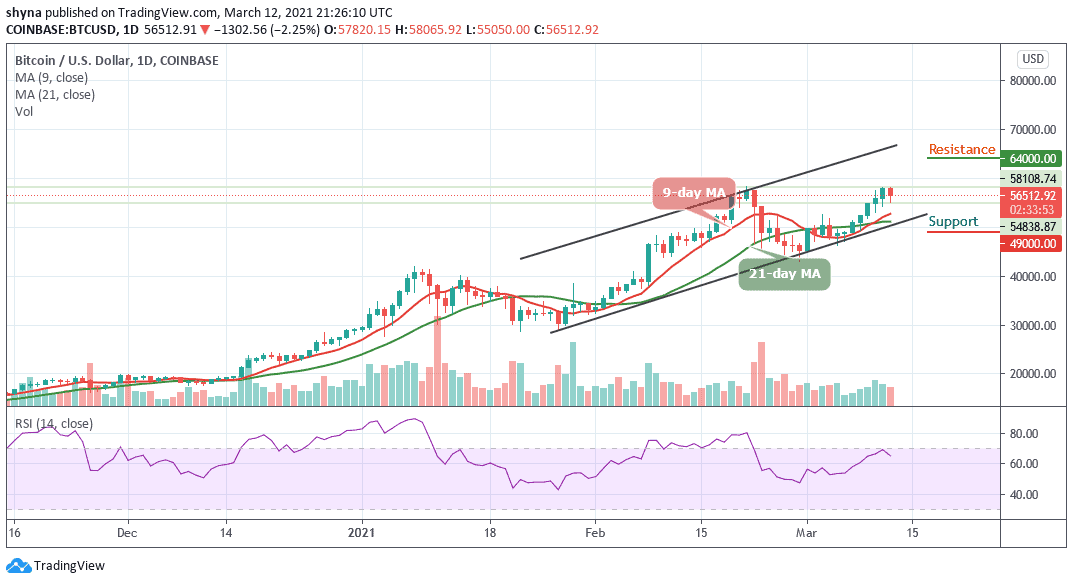
Comparing with Bitcoin, the Litecoin price crosses above the moving averages in other to reach the resistance level of 3931 SAT. More so, this resistance level is expected to effectively exceed so that the market price may end up closing above it, there might not be any reason to expect the long-term bullish reversal.

On the other hand, if the price trades below the lower boundary of the channel, it could refresh lows under 3500 SAT and a possible bearish continuation may likely meet the major support at 3300 SAT before falling to 3200 SAT and below while the buyers may push the coin to the potential resistance at 4200 SAT and above. To support the bullish movement, the technical indicator RSI (14) is moving toward the north to give more bullish signals.
Join Our Telegram channel to stay up to date on breaking news coverage