Join Our Telegram channel to stay up to date on breaking news coverage
Bitcoin (BTC) Price Prediction – March 12
The Bitcoin (BTC) is recovering from the recent low of $55,050 but bulls may have trouble taking the market price above $58,000.
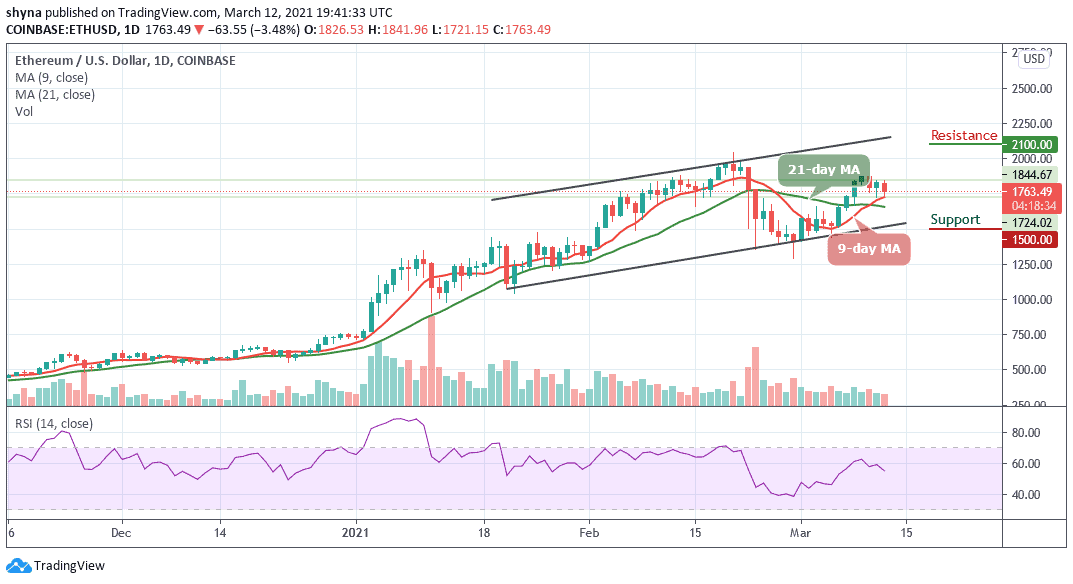
BTC/USD Long-term Trend: Bullish (Daily Chart)
Key levels:
Resistance Levels: $64,000, $66,000, $68,000
Support Levels: $49,000, $51,000, $53,000

At the time of writing, BTC/USD is trading down by 2.25% at its current price of $56,512. This is the spot where the coin has been trading for the past few days, with the selling pressure seen in the $55,050 region proving significant. Moreover, where the coin may go next could depend on whether or not bulls can take control of it before it breaks below $55,000 or $53,000.
What to Expect from BTC?
On the upside, BTC/USD is likely to face sellers near the $56,000 zone. A clear close below the $55,000 resistance could most likely start a strong selling pressure. Meanwhile, the next target for the bulls could be $60,000 in the near term. Any more gains could lead the price towards the $64,000, $66,000, and #68,000 support levels.
However, if Bitcoin fails to clear the $56,000 resistance, it could correct lower. The first key support is located around the $53,000 level. The main support is near the trend line and $50,000. Any more losses might call for a test of the $49,000 support level. If the bulls fail to defend the $56,000 support zone, the price is likely to dive towards the $51,000 support in the coming sessions.
BTC/USD Medium-Term Trend: Ranging (4H Chart)
On the 4-Hour chart, BTC price hovers around $56,956 and may take time to persistently trade above $58,000. More so, if the bulls gather enough strength and regroup, the upward movement may be able to near the $60,000 and $62,000 resistance level.
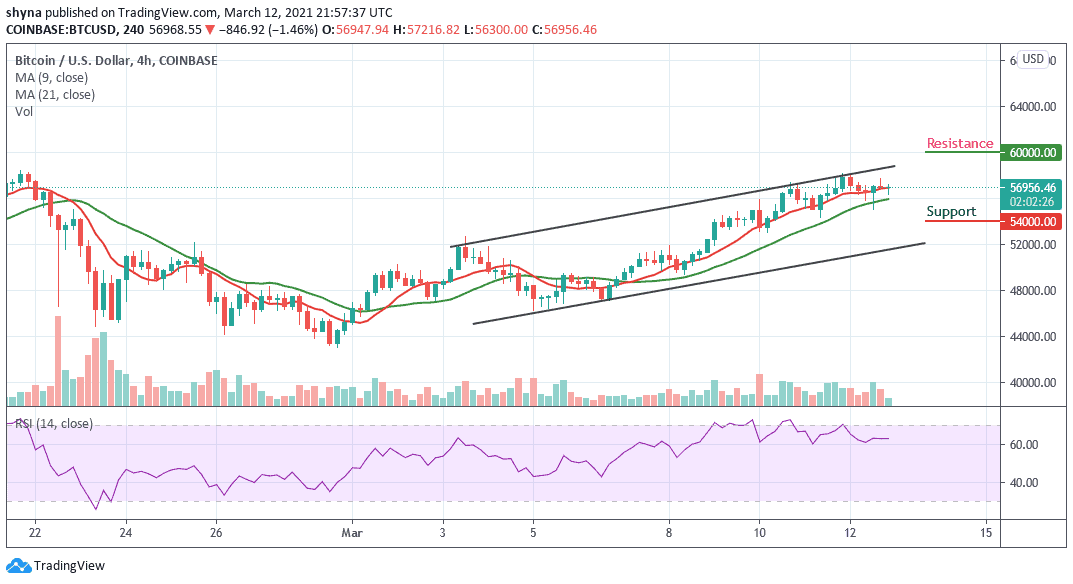
On the downside, immediate support is around the $55,000 level while the main support is at the $54,000 level. The price may likely fall below $53,000 if the bears step back into the market, a further movement could test the critical support at the $52,000 level. Technically, Bitcoin is currently moving in sideways as the technical indicator RSI (14) moves above the 60-level, indicating an indecisive market movement.
Join Our Telegram channel to stay up to date on breaking news coverage